Overview Dashboard
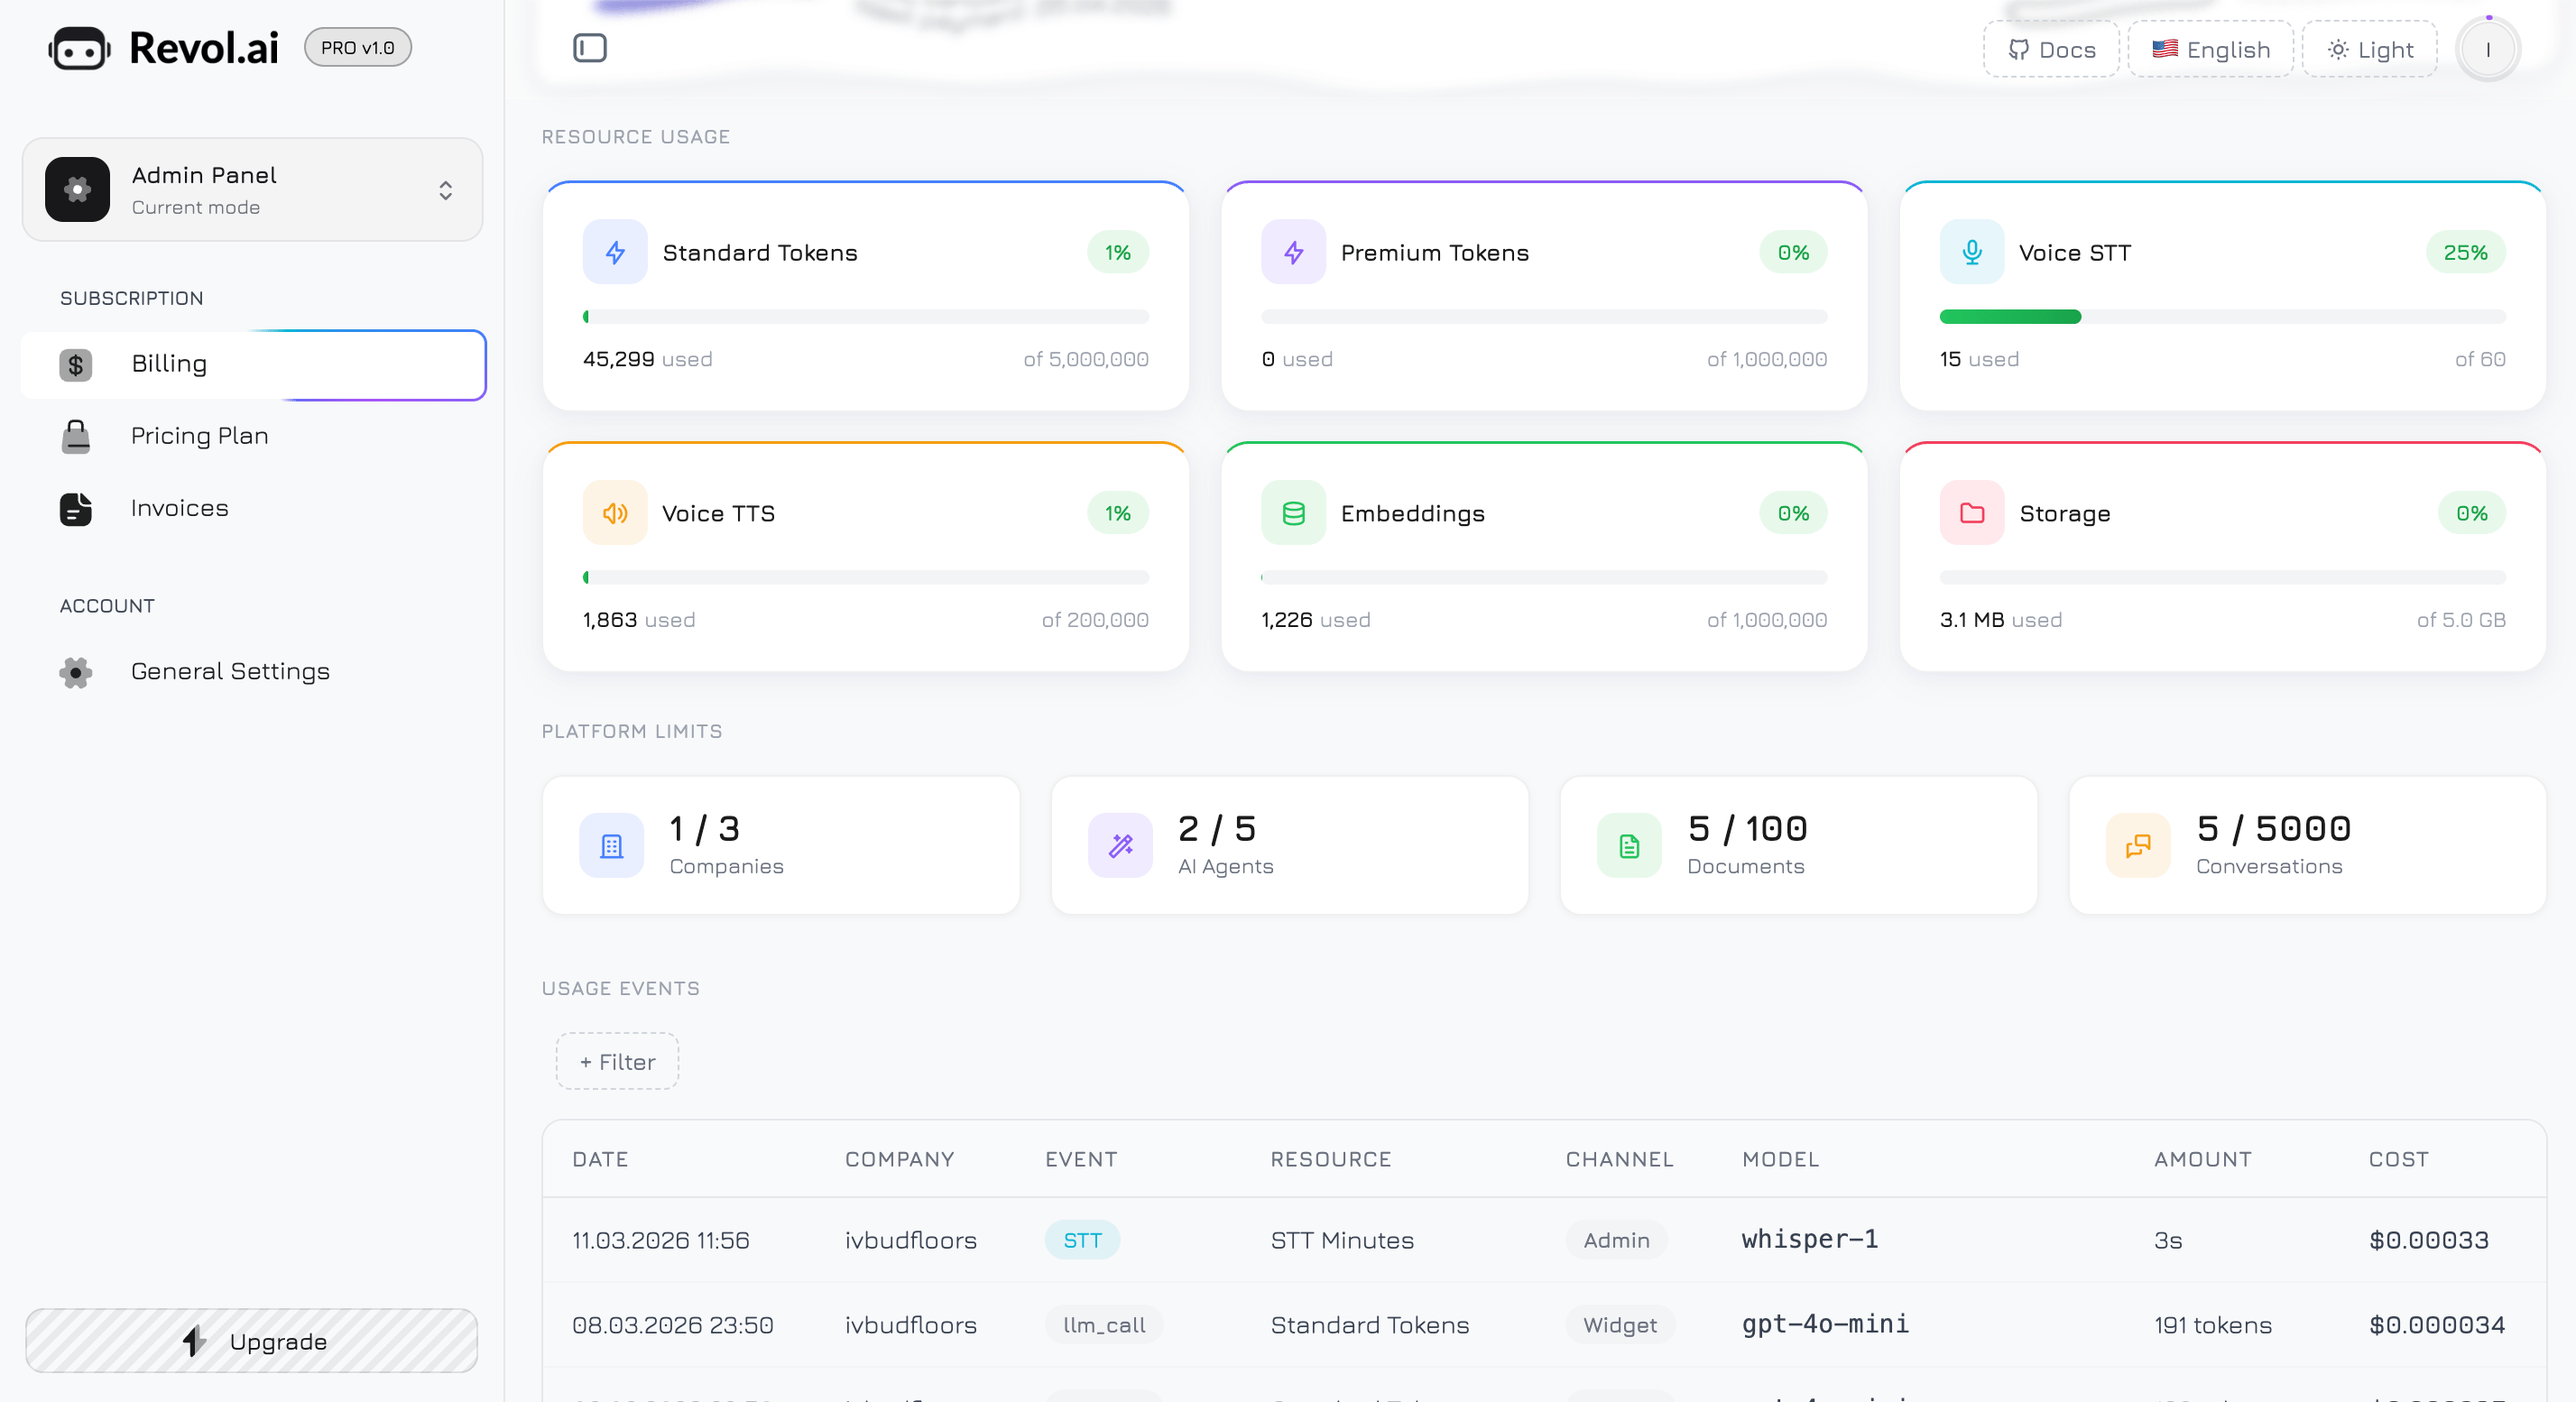
Navigate to Billing → Overview to open the Usage Analytics dashboard — a single page that gives you full visibility into resource consumption, platform limits, and a detailed log of every billable event.
The dashboard is divided into four sections: Plan Summary, Resource Usage, Platform Limits, and Usage Events.
Plan Summary
The top of the page displays a hero card with your current subscription details.
Left side:
- A gradient badge showing your plan name (Free, Premium, or Professional) with a crown icon
- If on a paid plan — the monthly price (e.g., $29 /mo) and the next payment date (e.g., “Next payment: 15.04.2026”)
- If on the Free plan — a prompt to upgrade
Right side:
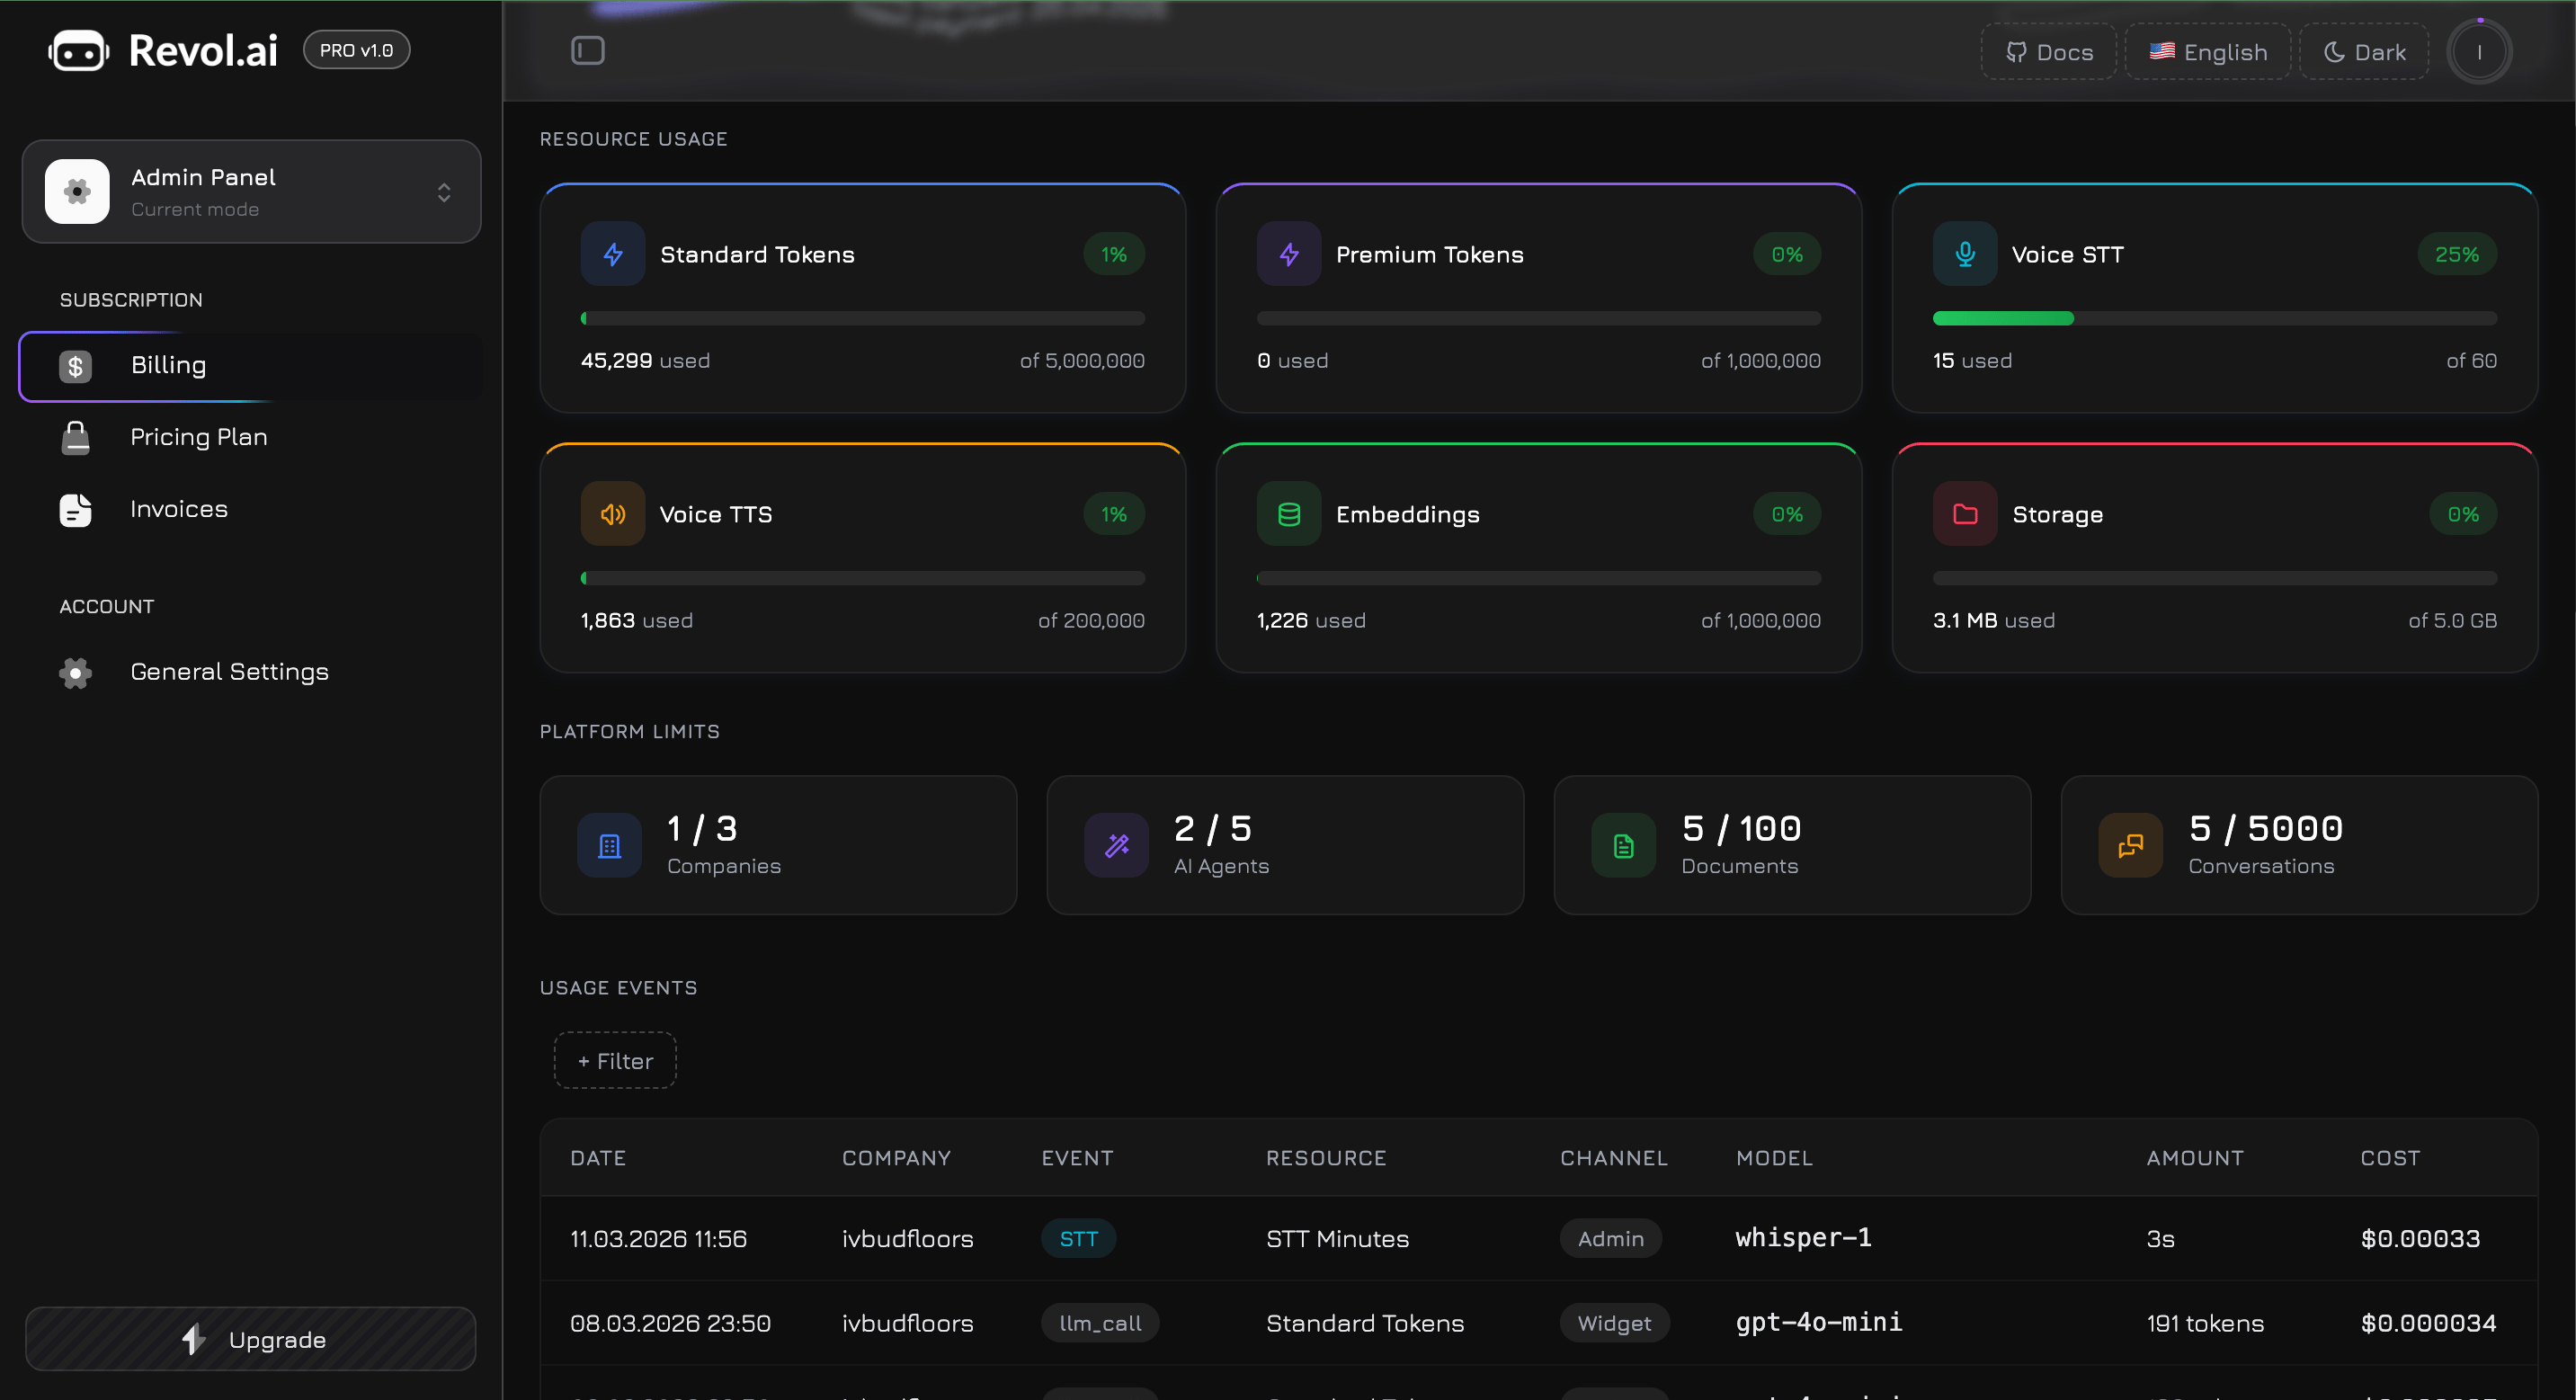
Resource Usage
Six progress-bar cards arranged in a 3-column grid (2 columns on tablet, 1 on mobile). Each card tracks one billable resource in real time.
| # | Resource | Icon | What It Measures |
|---|
| 1 | Standard Tokens | Bolt (blue) | Tokens consumed by standard models — GPT-4o Mini, Claude 3.5 Haiku, Gemini 2.0 Flash, Llama 3.1 8B |
| 2 | Premium Tokens | Bolt (purple) | Tokens consumed by premium models — GPT-4o, Claude 3.5 Sonnet, Gemini 2.5 Pro, Llama 3.3 70B |
| 3 | Voice STT | Microphone (cyan) | Speech-to-Text transcription time in minutes |
| 4 | Voice TTS | Speaker (amber) | Text-to-Speech synthesis in characters |
| 5 | Embeddings | Database (green) | Tokens used for knowledge base training (chunking + vector generation) |
| 6 | Storage | Folder (rose) | Total file storage across all your companies |
- Header row — the resource icon and label on the left, a percentage badge on the right
- Progress bar — an 8px-tall bar showing current consumption as a filled gradient
- Values row — “N used” on the left, “of N” (your plan limit) on the right
Color Thresholds
The percentage badge and progress bar change color based on how much you’ve consumed:
| Usage Level | Color | Meaning |
|---|
| Below 80% | Green | Normal — you have plenty of headroom |
| 80% – 89% | Amber | Warning — consider upgrading or buying a pack |
| 90% and above | Red | Critical — approaching the limit, requests may be blocked soon |
Storage values are displayed in human-readable units — MB for amounts under 1 GB, GB for larger values. All other resources show formatted numbers with thousands separators.
Four counter cards below the resource meters, arranged in a 4-column grid (2 on tablet, 1 on mobile). These show how many platform resources you’ve created versus your plan maximum:
| Icon | Counter | Example |
|---|
| Building (blue) | Companies | 2 / 3 |
| Wand (purple) | AI Agents | 4 / 5 |
| Document (green) | Knowledge Documents | 45 / 100 |
| Messages (amber) | Conversations | 1,200 / 5,000 |
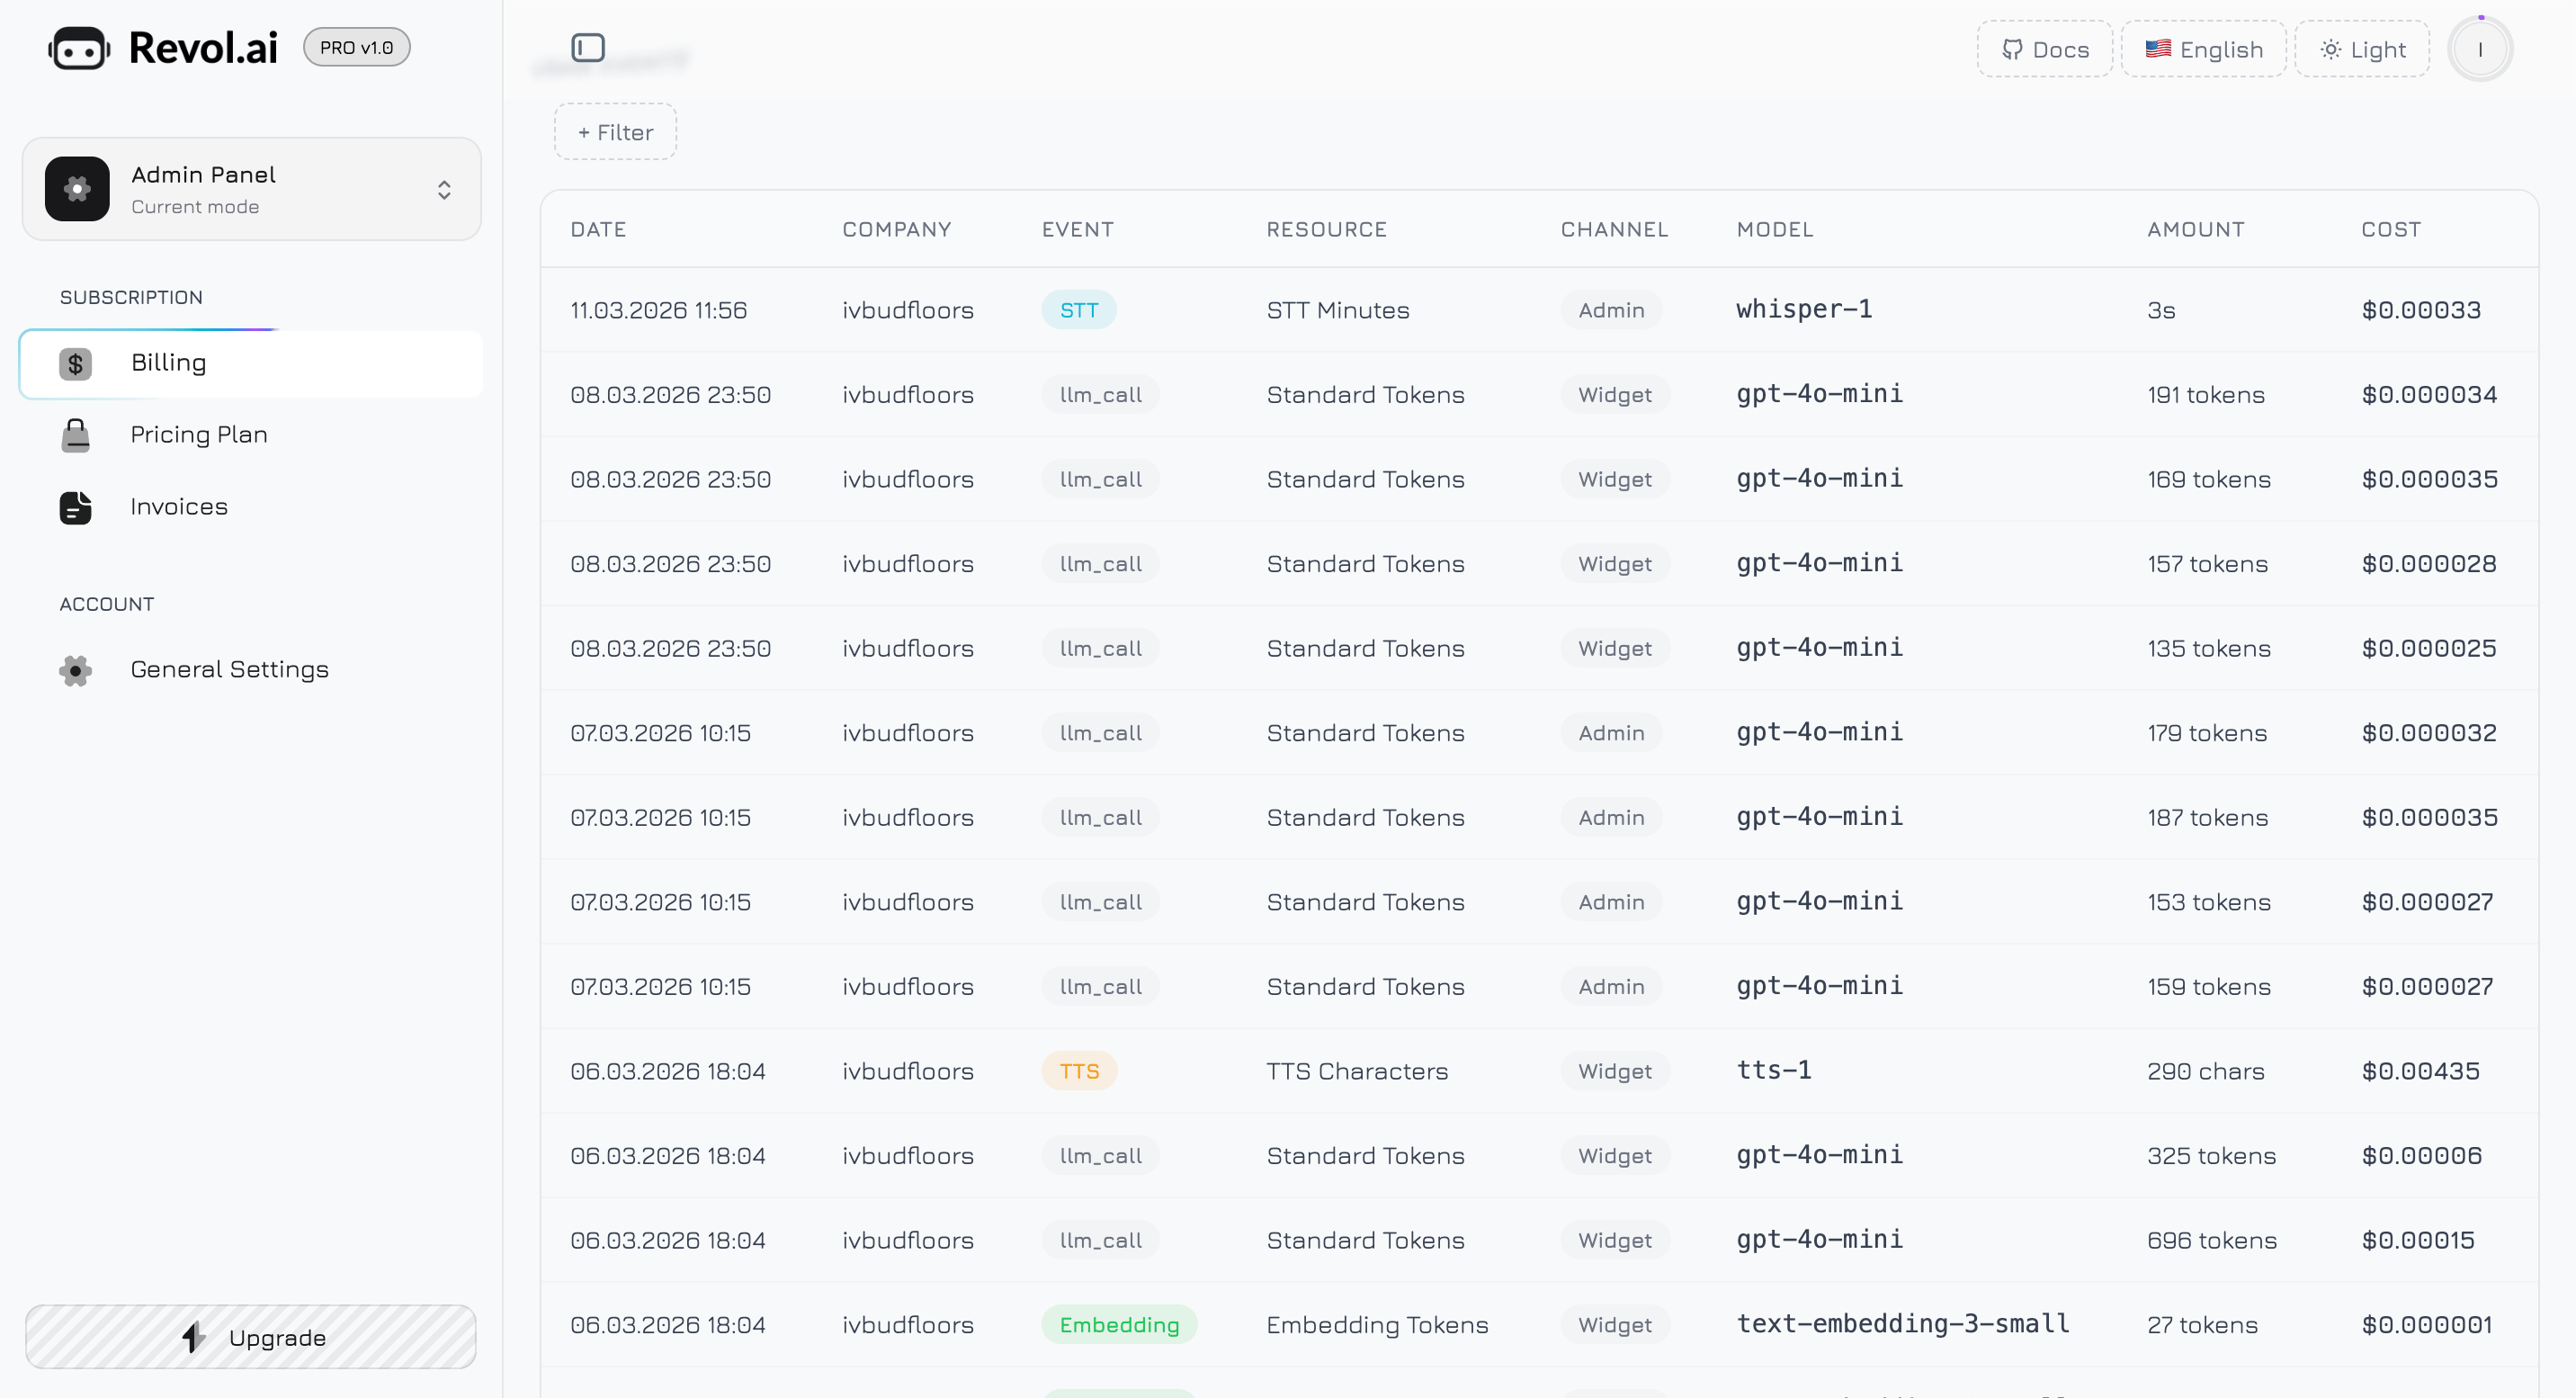
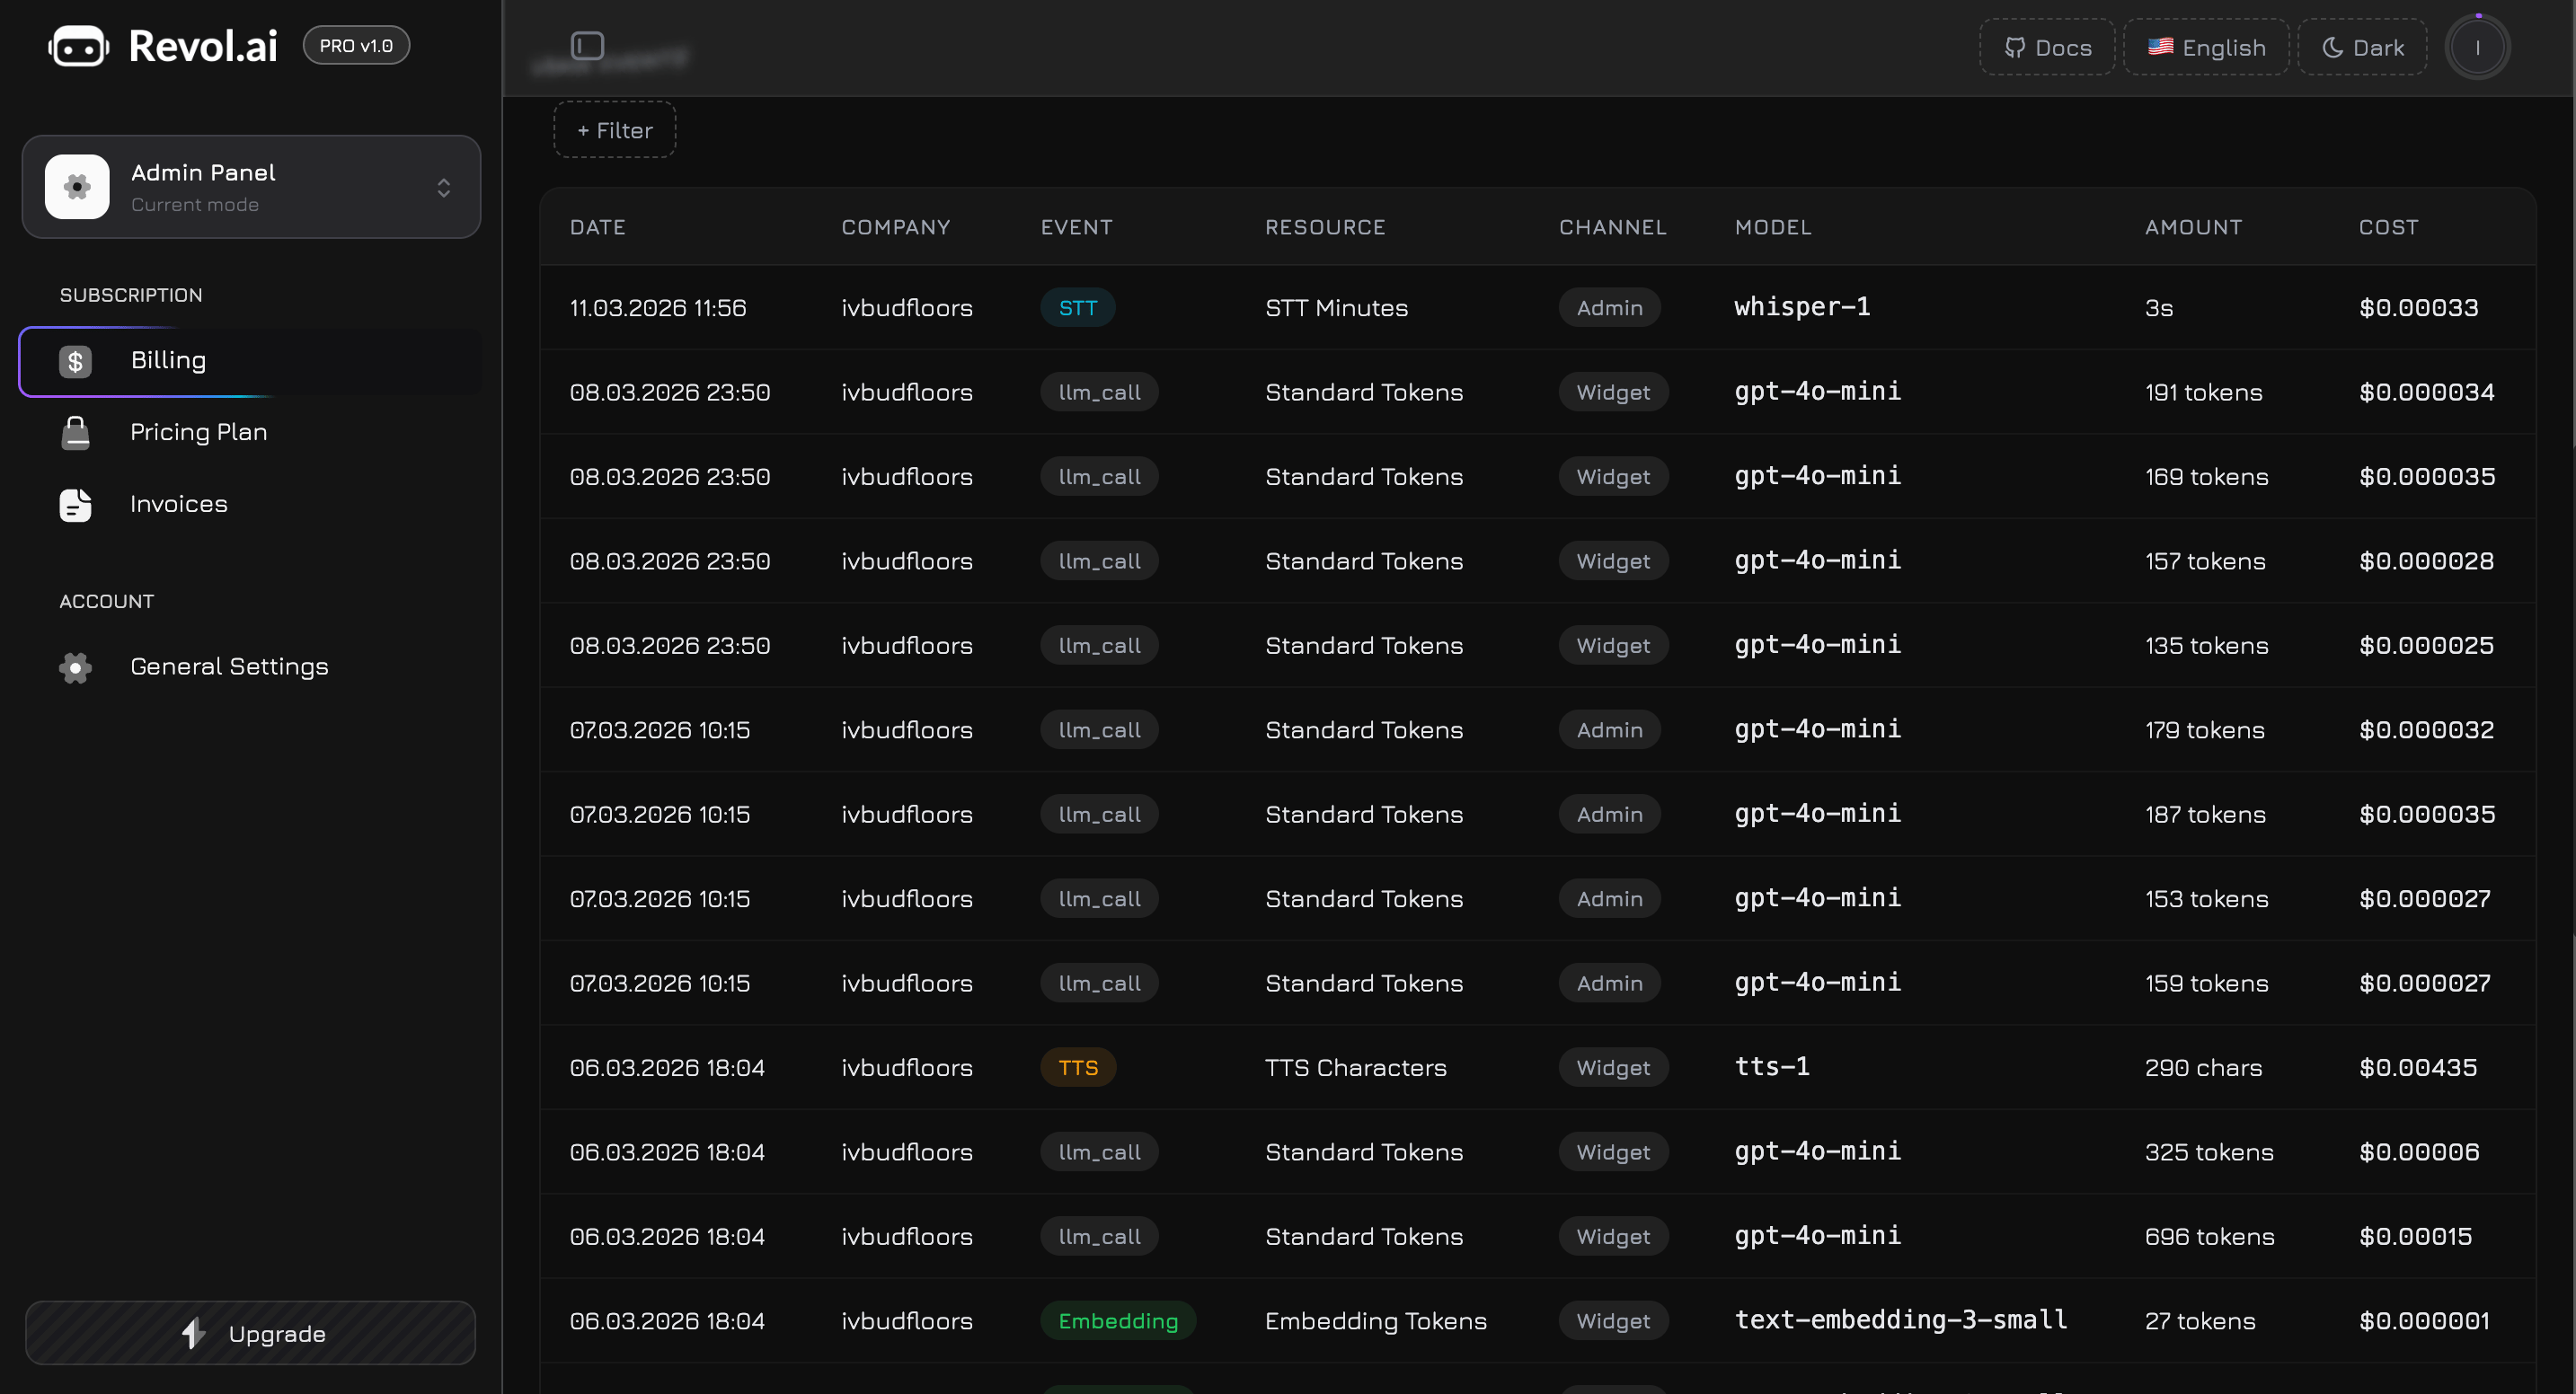
Usage Events
The bottom section contains a detailed, filterable table logging every billable action across all your companies. This is your audit trail for understanding exactly what consumed your quota.
Filtering
Click the + Filter button to add filter chips. Six filter types are available:
| Filter | Type | Options |
|---|
| Date From | Date picker | Calendar popover — select a start date |
| Date To | Date picker | Calendar popover — select an end date |
| Company | Select dropdown | Lists all your companies by name |
| Event Type | Select dropdown | Chat, Workflow, STT, TTS, Embedding, Storage |
| Resource | Select dropdown | Standard Tokens, Premium Tokens, STT Minutes, TTS Characters, Embedding Tokens, Storage |
| Channel | Select dropdown | Admin, Widget, System |
Table Columns
Each row in the table represents a single billable event with eight columns:
| Column | Description | Format |
|---|
| Date | When the event occurred | DD.MM.YYYY HH:mm |
| Company | Which company’s agent triggered the event | Company name, or — if system-level |
| Event | Type of billable action | Color-coded badge (see below) |
| Resource | Which resource quota was consumed | Plain text label |
| Channel | Where the interaction originated | Grey badge (Admin, Widget, System), or — |
| Model | Which LLM model was used | Monospace font (e.g., gpt-4o-mini), or — for non-LLM events |
| Amount | Quantity consumed | Smart-formatted (see below) |
| Cost | Estimated cost in USD | Bold, tabular numerics (see below) |
Event Type Badges
Each event type has a distinct color-coded badge for quick visual scanning:
| Event Type | Badge Color | Description |
|---|
| Chat | Blue | LLM inference from a chat conversation |
| Workflow | Purple | LLM inference from a workflow node execution |
| STT | Cyan | Speech-to-Text transcription |
| TTS | Amber | Text-to-Speech synthesis |
| Embedding | Green | Knowledge base training (vector generation) |
| Storage | Rose | File upload or storage operation |
| Resource | Format | Example |
|---|
| Tokens (Standard, Premium, Embedding) | Comma-separated number + “tokens” | 4,521 tokens |
| STT Minutes | Minutes and seconds | 2m 34s |
| TTS Characters | Comma-separated number + “chars” | 1,250 chars |
| Storage | MB or KB | 3.2 MB, 450 KB |
- **0.01andabove∗∗—displayedwith2decimalplaces(e.g.,‘1.25`)
- **Below 0.01∗∗—displayedwithupto8decimalplaces,trailingzerosremoved(e.g.,‘0.00042`)
- Zero or not applicable — displayed as
—
The table loads 25 events per page and uses asynchronous pagination. The bottom bar shows:
- “Showing X–Y of Z” — current range and total count
- Page buttons — first page, last page, and a window of ±2 pages around the current one, with ellipsis (
…) for gaps
While loading, the table displays an animated skeleton with 8 shimmer rows. If no events match your filters, an empty state message appears: “No usage events found.”
How Tokens Work
Every AI interaction consists of two parts:
- Input tokens — your message + system prompt + knowledge base context (RAG chunks) + conversation history + tool descriptions
- Output tokens — the agent’s response
Both count toward your quota. The total per interaction depends on:
- System prompt length — longer prompts consume more input tokens per message
- Knowledge base context — more RAG chunks retrieved = more input tokens. Control this via RAG Settings → Chunk Limit
- Conversation history — longer conversations accumulate context from previous messages
- Response length — controlled by the Response Length personality slider in agent settings
- Tool calls — each tool call round adds input tokens (tool descriptions) and output tokens (tool arguments + results)
Token Types
| Token Type | Models | Cost Profile |
|---|
| Standard | GPT-4o Mini, Claude 3.5 Haiku, Gemini 2.0 Flash, Llama 3.1 8B | Lower cost, faster responses |
| Premium | GPT-4o, Claude 3.5 Sonnet, Gemini 2.5 Pro, Llama 3.3 70B | Higher cost, better quality |
| Embedding | text-embedding-ada-002 | Used only during knowledge base training |
To optimize token usage: keep system prompts concise, limit the number of RAG chunks per query (RAG Settings → Chunk Limit), and use standard models for simple tasks while reserving premium models for complex responses.
Voice Usage
Voice interactions consume two separate resources:
- STT (Speech-to-Text) — measured in minutes. Each voice message is transcribed, and the duration (rounded up to the nearest minute) is deducted from your quota.
- TTS (Text-to-Speech) — measured in characters. The agent’s text response is synthesized to audio, and the character count is deducted.
A single voice conversation turn typically consumes both STT minutes (the visitor’s audio) and TTS characters (the agent’s spoken response). These appear as separate rows in the Usage Events table — an STT event (cyan badge) and a TTS event (amber badge).
Storage Usage
Storage is consumed when you upload files to the File Manager:
- Documents — PDF, Word, Excel, TXT
- Photos — JPG, PNG
- Videos — MP4, WebM, MOV
- Audio recordings — conversation audio files
Storage usage is tracked bidirectionally — uploading increases usage, deleting files decreases it. The Storage meter on the dashboard shows your current total across all companies.
Quota Notifications
Revol monitors your usage and sends alerts before you hit limits:
| Threshold | Level | Notification |
|---|
| 80% | Warning | Email + in-app banner: “You’ve used 80% of your [resource]. Consider upgrading or purchasing a pack.” |
| 90% | Critical | Email + in-app banner: “You’ve used 90% of your [resource]. Requests will be blocked at 100%.” |
What Happens at the Limit
| Resource | Behavior |
|---|
| Standard / Premium Tokens | Agent stops responding until the next billing cycle or until you purchase a pack |
| Storage | Cannot upload new files to the File Manager |
| Voice (STT/TTS) | Voice features are disabled, text chat continues working |
| Conversations | New conversations are blocked, existing ones continue |
| Knowledge Docs | Cannot add new documents to agent knowledge bases |
Billing Period
- Free plan — daily billing period. Token usage resets every day at midnight UTC.
- Paid plans — monthly billing period. Usage resets on the anniversary of your subscription date (e.g., if you subscribed on March 15, your next reset is April 15).
Add-on packs are independent of the billing period — they have their own 3-month expiration from the purchase date. When your included plan quota is exhausted, consumption automatically switches to your oldest-expiring pack.