Overview
The Sessions page provides a detailed view of all visitor sessions within a campaign. Click any campaign row in the Campaigns tab to open a fullscreen session viewer — a powerful tool for understanding how visitors navigate your website, what pages they view, and whether they start conversations with your AI agent.
Campaign Session Viewer
The session viewer opens as a fullscreen modal with the campaign name, status badge, and ID in the header. The header also provides quick actions:
| Action | Description |
|---|
| Embed | Get the embed code for this campaign’s tracking link |
| Preview | Preview the campaign landing page |
| Settings | Quick access to campaign source, medium, ID, and edit/delete actions |
Live Tab
The Live tab shows real-time visitor activity for the campaign. When visitors are actively browsing your website through this campaign’s tracking link, their page transitions appear here as they happen.
Live Canvas
The left side displays a real-time page flow graph. As visitors navigate between pages, the graph updates with animated connections showing the path from one page to another.
Canvas controls:
| Button | Description |
|---|
| Refresh | Reload the live data |
| Zoom In / Out | Adjust the graph zoom level |
| Reset Zoom | Return to default zoom |
Active Visitors Panel
The right side shows a list of active visitors with a live indicator (pulsing green dot) and count. Each active visitor card shows their device type, browser, and current page.
Sessions Tab
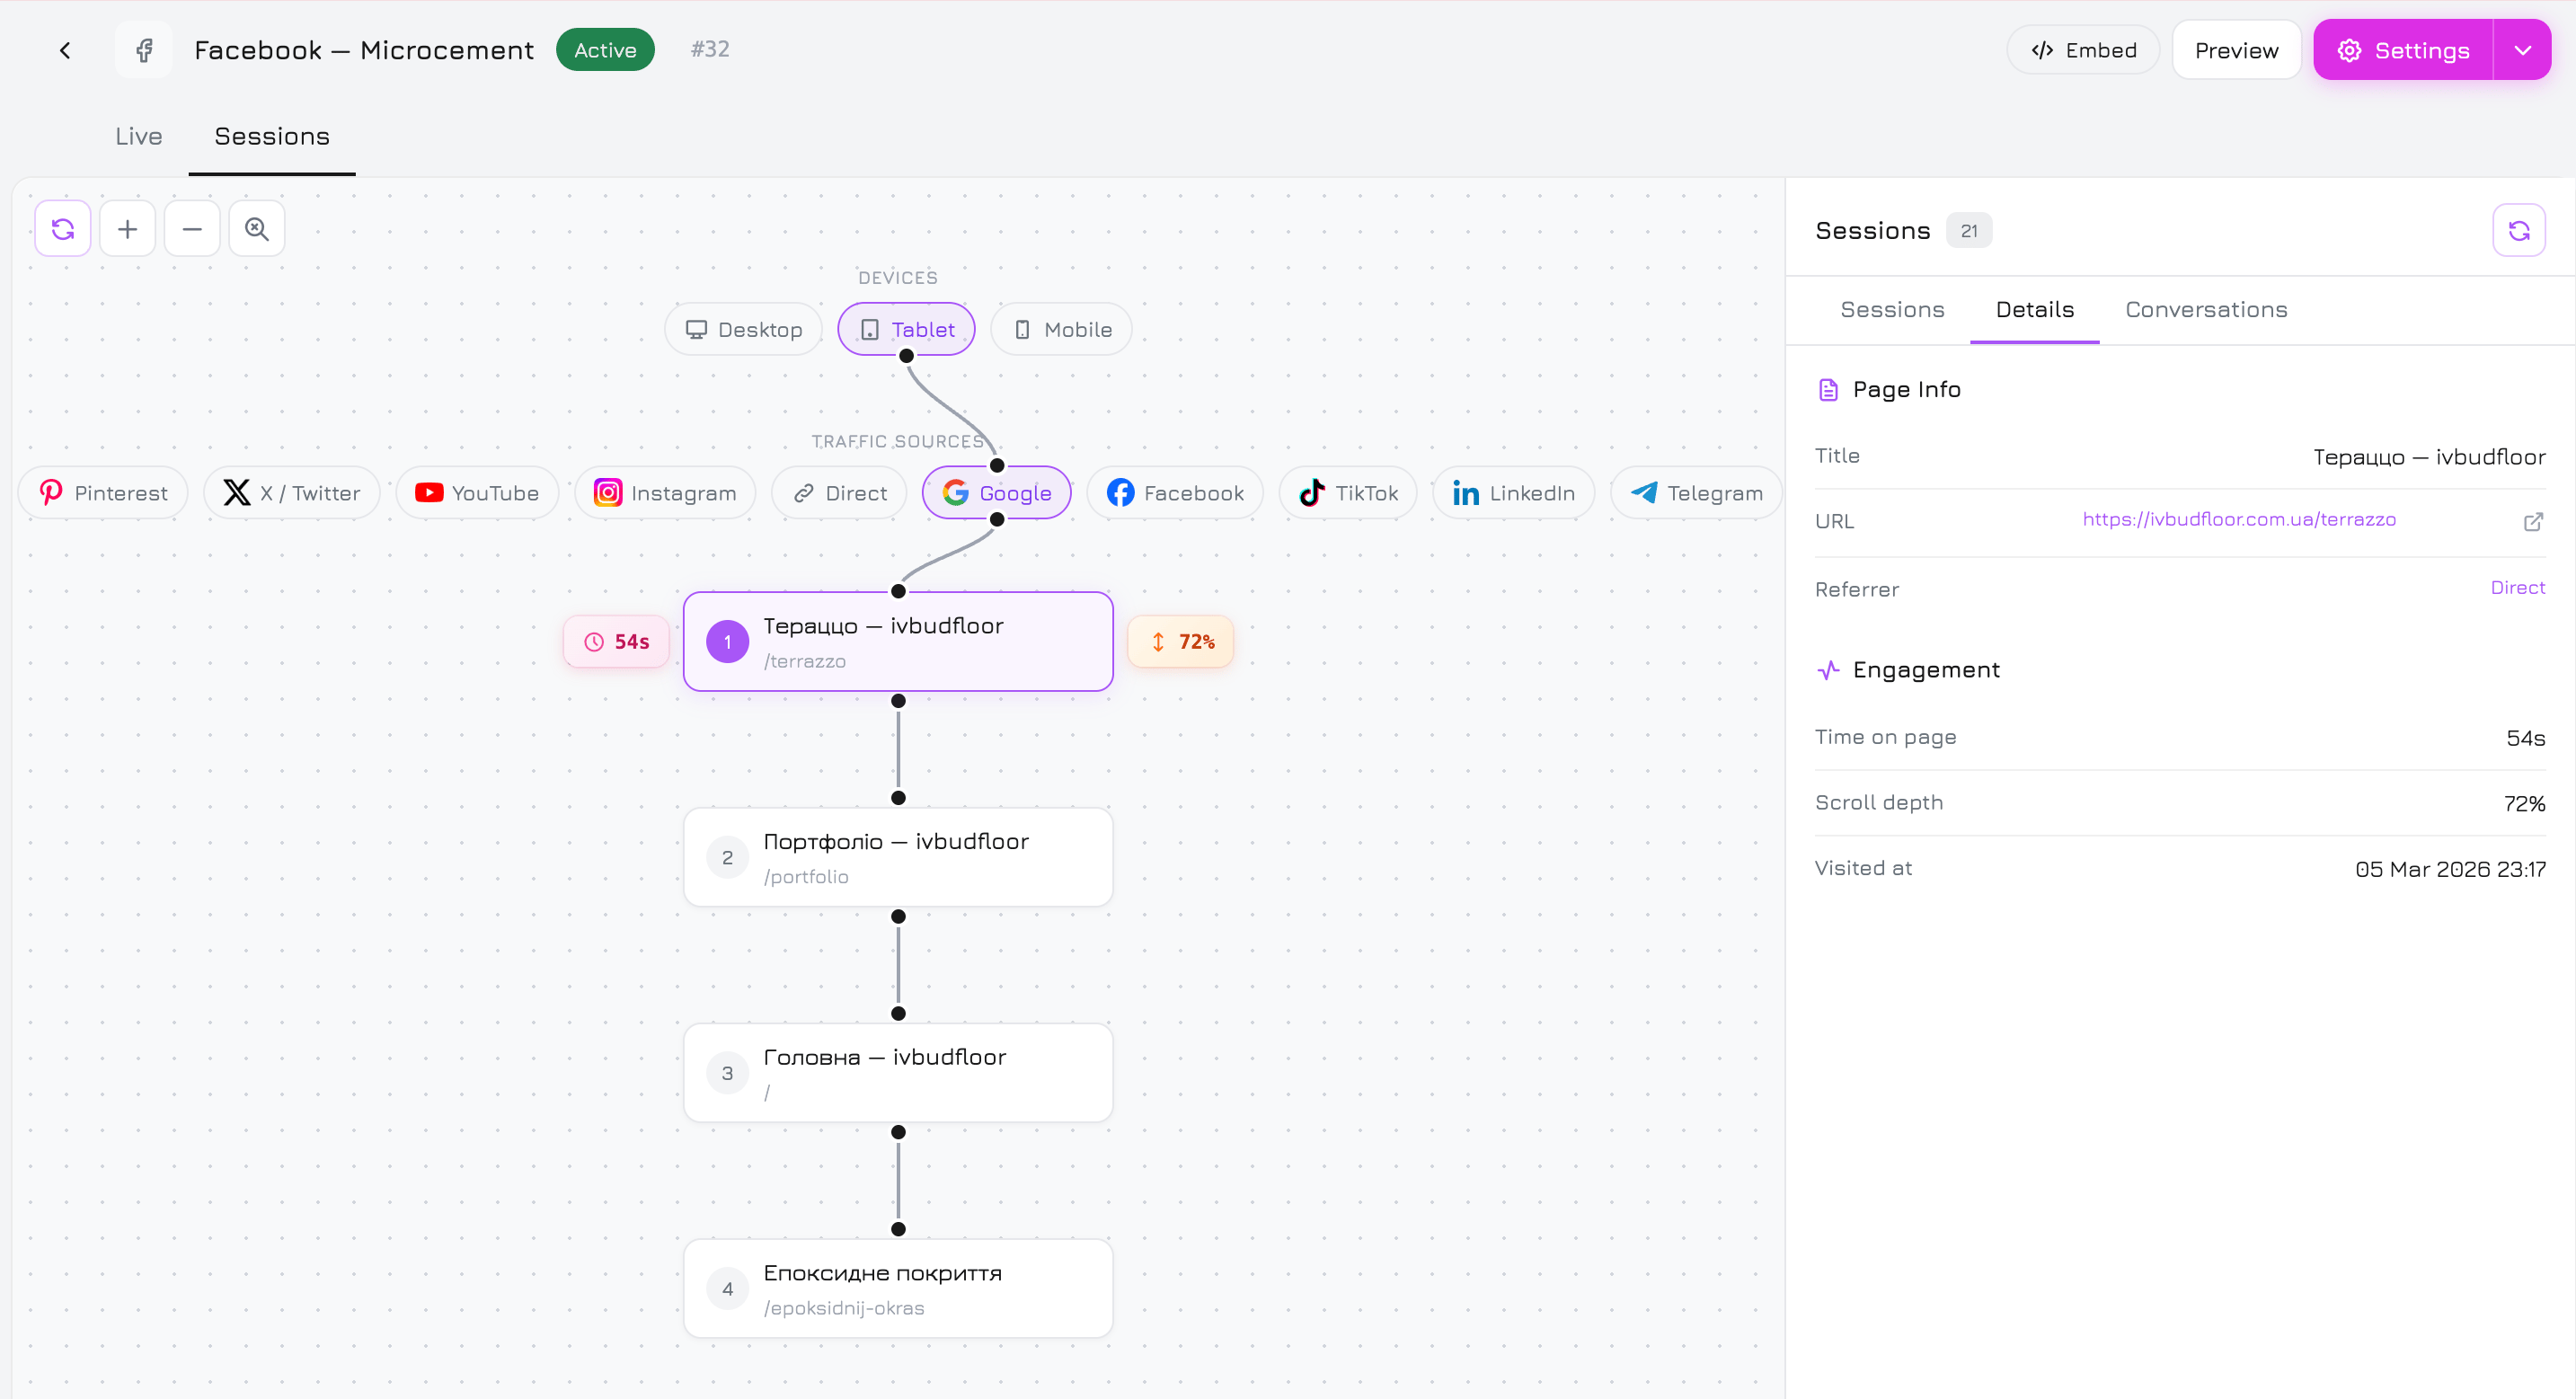
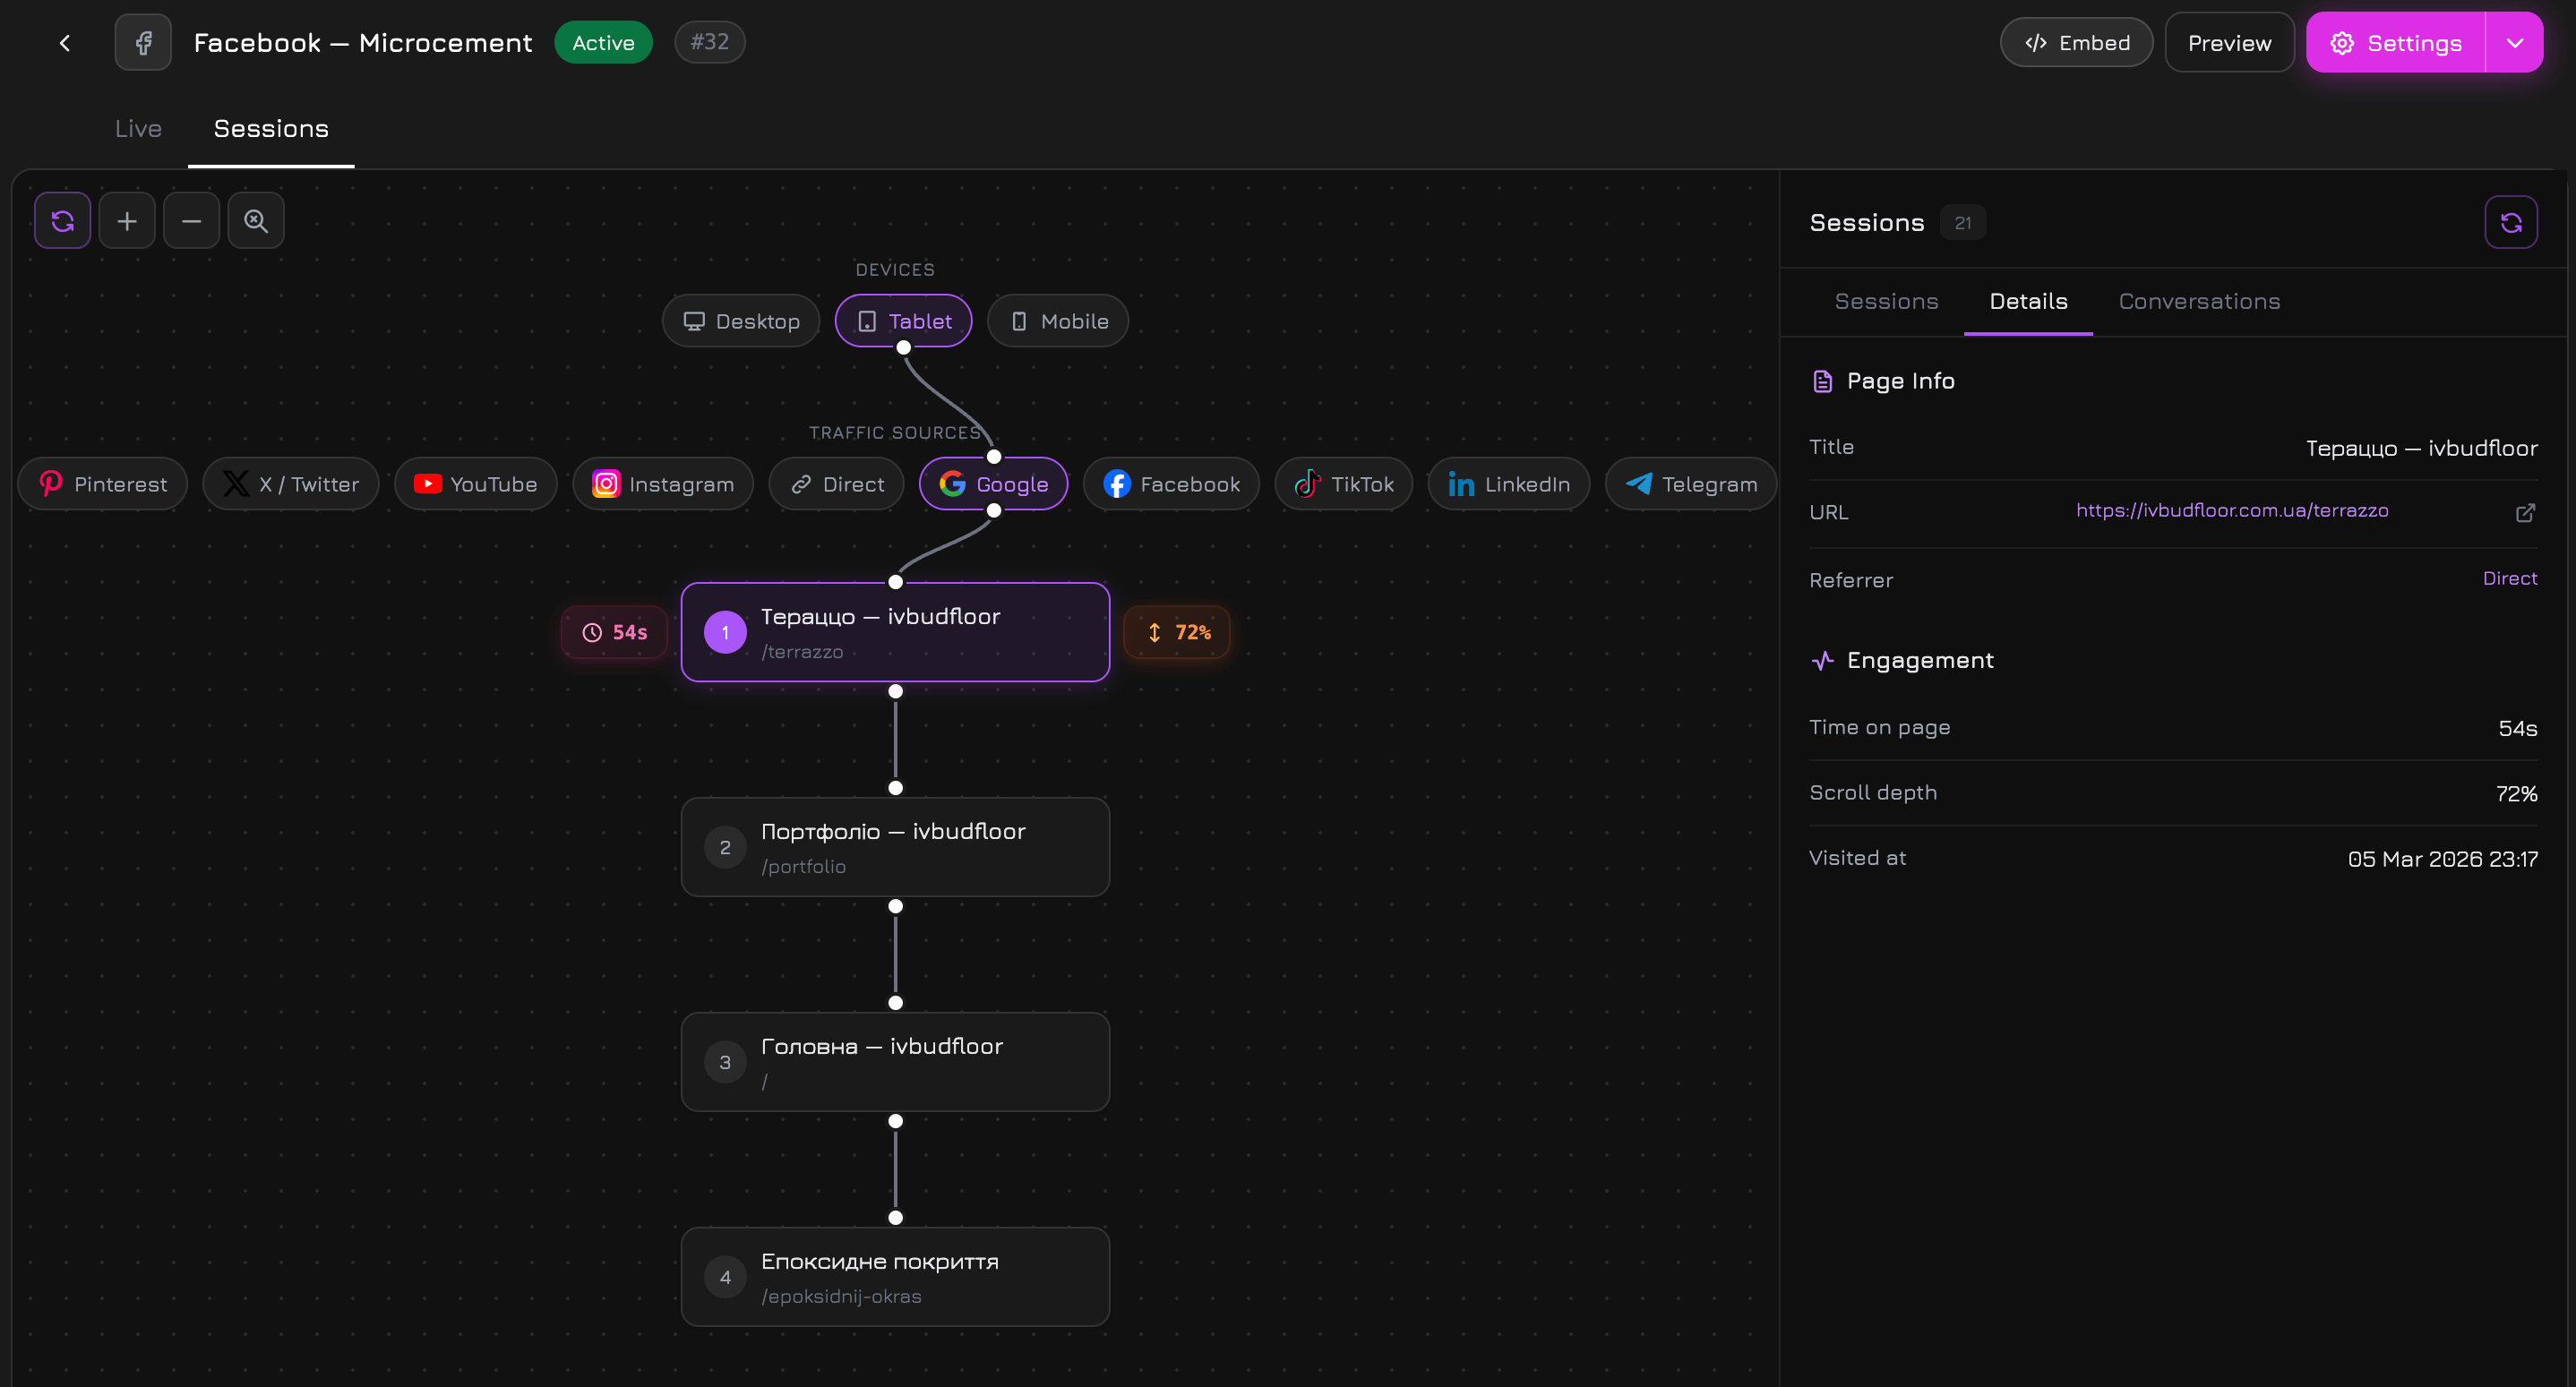
The Sessions tab shows all historical sessions attributed to this campaign. This is where you analyze past visitor behavior in detail.
Page Flow Graph
The left side displays a visual page flow graph for the selected session — a vertical chain of page nodes showing the visitor’s journey through your website.
Filter Pills
At the top of the graph, two rows of interactive filter pills help you narrow down sessions:
| Filter | Description |
|---|
| Devices | Filter by Desktop, Tablet, or Mobile. Click a pill to show only sessions from that device type. |
| Traffic Sources | Filter by source — Google, Facebook, Instagram, TikTok, Telegram, Direct, and 20+ other sources. Each source shows its logo for quick identification. |
Page Nodes
Each page in the visitor’s journey is shown as a page node with:
| Element | Description |
|---|
| Number | Sequential page number in the visit (1, 2, 3…) |
| Page Title | The HTML title of the page |
| Page URL | The URL path (e.g., /portfolio, /terrazzo) |
| Time Badge | Time spent on this page (e.g., ”54s”, “1m 47s”) — shown on the left |
| Scroll Badge | Scroll depth percentage (e.g., “72%”, “60%”) — shown on the right |
Right Panel
The right panel has three sub-tabs: Sessions, Details, and Conversations.
Sessions Sub-Tab
A scrollable list of all campaign sessions. Each session card shows:
| Element | Description |
|---|
| Source Icon | Traffic source logo (Google, Facebook, Telegram, TikTok, Direct, etc.) |
| Device Icon | Desktop, tablet, or mobile icon |
| Visitor Token | Unique anonymous visitor identifier (e.g., rvl_Bf0G) |
| Bounce Badge | Red “Bounce” label if the visitor viewed only one page |
| Time Ago | Relative time since the session (e.g., “2d ago”, “15d ago”) |
| Pages Count | Number of pages viewed |
| Duration | Total session duration (e.g., “6m 54s”) |
| Browser | Browser name (Chrome, Safari, Firefox, Edge, Samsung Internet) |
| Location | Country code and city (e.g., “UA, Kyiv”, “DE, Hamburg”) |
Details Sub-Tab
When you click a page node in the graph, the Details sub-tab shows full information about that specific pageview:
Page Info:
| Field | Description |
|---|
| Title | Full page title |
| URL | Complete page URL (with external link to open in a new tab) |
| Referrer | The previous page URL the visitor came from |
| Field | Description |
|---|
| Time on page | How long the visitor stayed on this page |
| Scroll depth | How far down the visitor scrolled (percentage) |
| Visited at | Exact date and time of the pageview |
Conversations Sub-Tab
If the visitor started a chat conversation with your AI agent during the session, the full conversation transcript appears here — including both visitor messages and agent responses.
If the session has no linked conversation, the panel shows: “No conversation linked to this session.”
The Conversations sub-tab lets you see the exact context of a conversation — which pages the visitor browsed before starting the chat, how long they spent, and what they discussed with the AI agent. This is invaluable for understanding visitor intent and improving your agent’s responses.
Session Indicators
Sessions use visual indicators to quickly communicate key information:
| Indicator | Meaning |
|---|
| Source logo | Where the visitor came from (Google, Facebook, Instagram, TikTok, Telegram, Direct, etc.) |
| Device icon | Desktop monitor, tablet, or mobile phone |
| ”Bounce” badge | Visitor viewed only 1 page and left |
| Returning visitor | Same rvl_ token appearing in multiple sessions |
| Time badges on nodes | Time spent on each individual page |
| Scroll badges on nodes | How far the visitor scrolled on each page |