> ## Documentation Index
> Fetch the complete documentation index at: https://revolai.mintlify.site/llms.txt
> Use this file to discover all available pages before exploring further.
# Dashboard
> Real-time analytics dashboard with KPIs, traffic charts, geographic data, and campaign performance
## Overview
The Revol Tracker monitors visitor activity on your website. It collects session data, pageviews, custom events, and campaign attribution — all through the same script that powers the chat widget. No additional code needed.
The Dashboard provides a real-time overview of your website's traffic and visitor behavior. Data refreshes automatically every **60 seconds**.
 ### Data Availability
Analytics data is stored in monthly partitions and cleaned up automatically based on your plan:
| Plan | Data Retention |
| ------------ | -------------- |
| Free | 3 months |
| Premium | 12 months |
| Professional | 24 months |
### Filters
Use filters to narrow down the dashboard data:
**Quick period selector:**
| Period | Description |
| ------- | --------------------- |
| **24h** | Last 24 hours |
| **7d** | Last 7 days (default) |
| **30d** | Last 30 days |
| **90d** | Last 90 days |
**Advanced filters** (dropdown):
| Filter | Description |
| ------------- | ----------------------------------------- |
| **Device** | Desktop, Mobile, or Tablet |
| **Country** | Filter by country (2-letter ISO code) |
| **Source** | UTM source (e.g., google, facebook) |
| **Page URL** | Filter by specific page |
| **Browser** | Chrome, Firefox, Safari, etc. |
| **OS** | Windows, macOS, iOS, Android, etc. |
| **Bounce** | Show only bounced or non-bounced sessions |
| **Campaign** | Select from your campaigns list |
| **Medium** | cpc, organic, social, email, referral |
| **Date From** | Custom start date |
| **Date To** | Custom end date |
Without filters, the dashboard uses pre-aggregated data for fast loading. When filters are applied, it switches to raw queries for accurate results — this may take slightly longer.
***
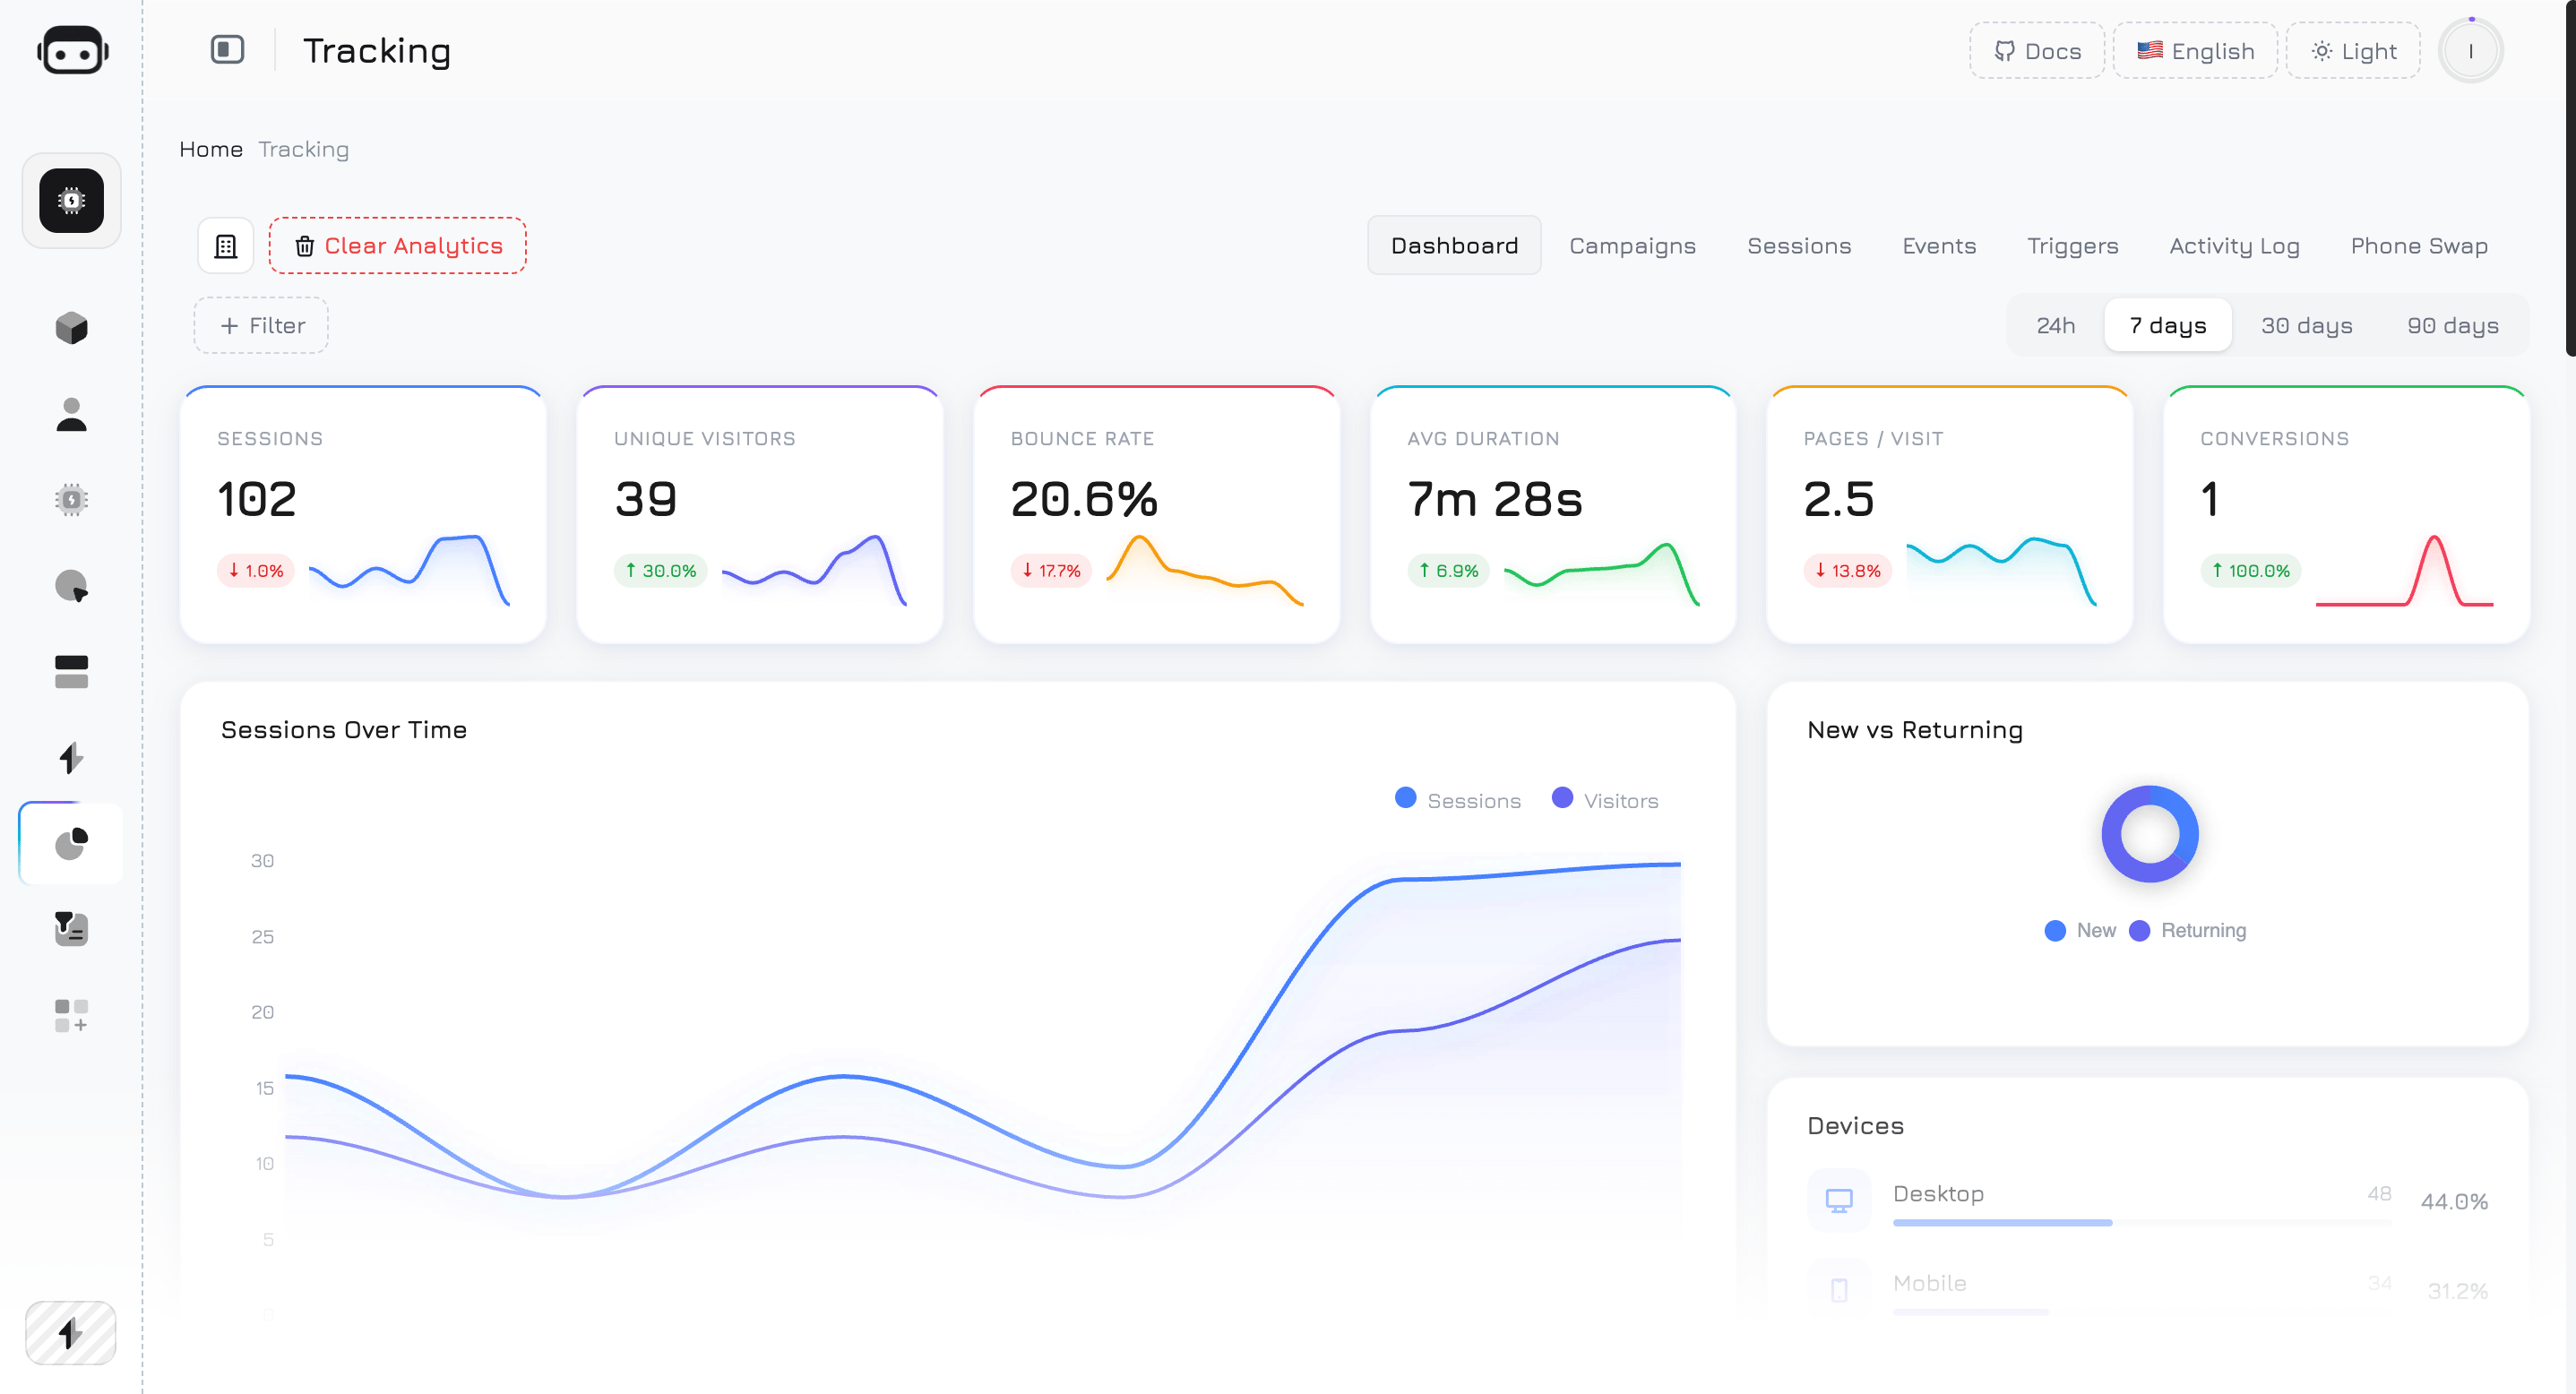
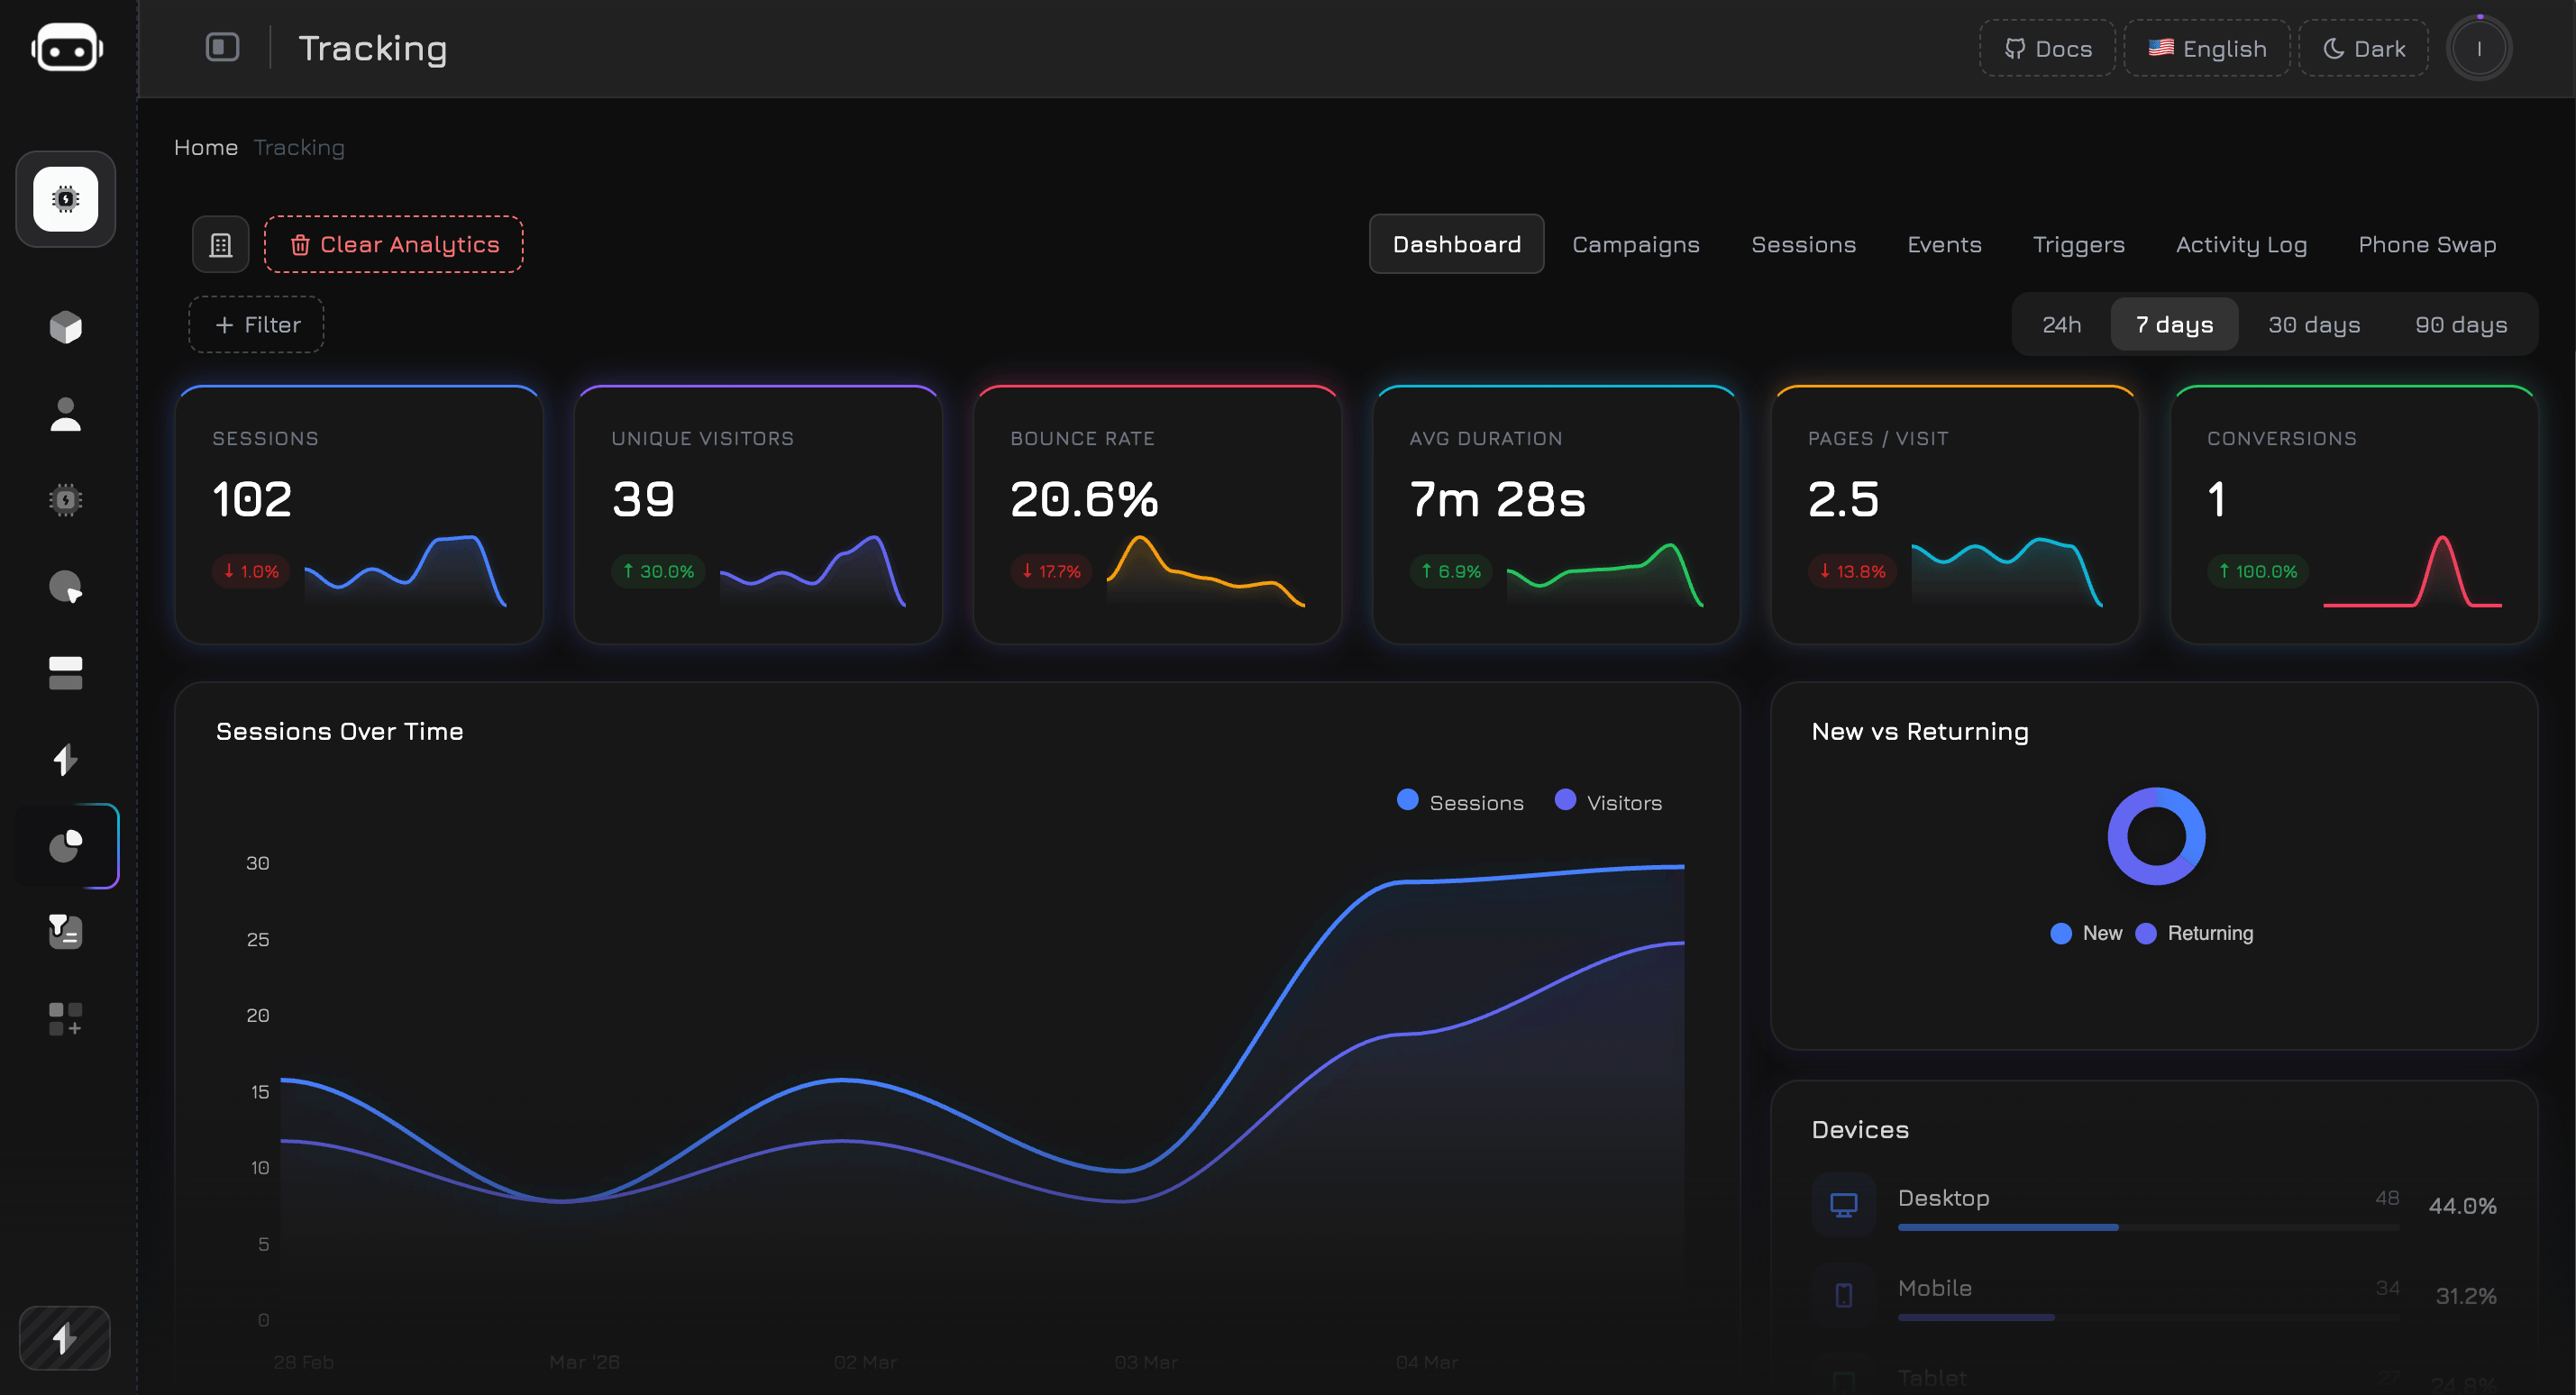
## KPI Cards
The top row shows 6 key performance indicators. Each card displays the current value, a **trend percentage** compared to the previous period of equal length, and a **7-day sparkline** chart.
### Data Availability
Analytics data is stored in monthly partitions and cleaned up automatically based on your plan:
| Plan | Data Retention |
| ------------ | -------------- |
| Free | 3 months |
| Premium | 12 months |
| Professional | 24 months |
### Filters
Use filters to narrow down the dashboard data:
**Quick period selector:**
| Period | Description |
| ------- | --------------------- |
| **24h** | Last 24 hours |
| **7d** | Last 7 days (default) |
| **30d** | Last 30 days |
| **90d** | Last 90 days |
**Advanced filters** (dropdown):
| Filter | Description |
| ------------- | ----------------------------------------- |
| **Device** | Desktop, Mobile, or Tablet |
| **Country** | Filter by country (2-letter ISO code) |
| **Source** | UTM source (e.g., google, facebook) |
| **Page URL** | Filter by specific page |
| **Browser** | Chrome, Firefox, Safari, etc. |
| **OS** | Windows, macOS, iOS, Android, etc. |
| **Bounce** | Show only bounced or non-bounced sessions |
| **Campaign** | Select from your campaigns list |
| **Medium** | cpc, organic, social, email, referral |
| **Date From** | Custom start date |
| **Date To** | Custom end date |
Without filters, the dashboard uses pre-aggregated data for fast loading. When filters are applied, it switches to raw queries for accurate results — this may take slightly longer.
***
## KPI Cards
The top row shows 6 key performance indicators. Each card displays the current value, a **trend percentage** compared to the previous period of equal length, and a **7-day sparkline** chart.
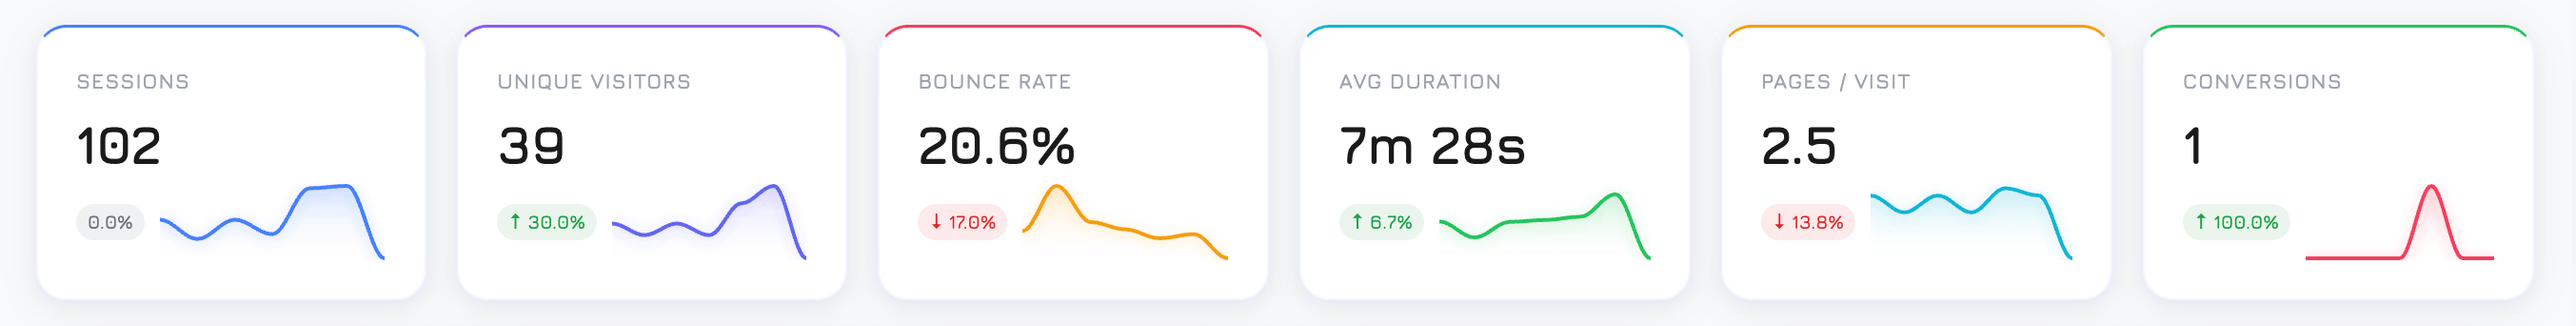
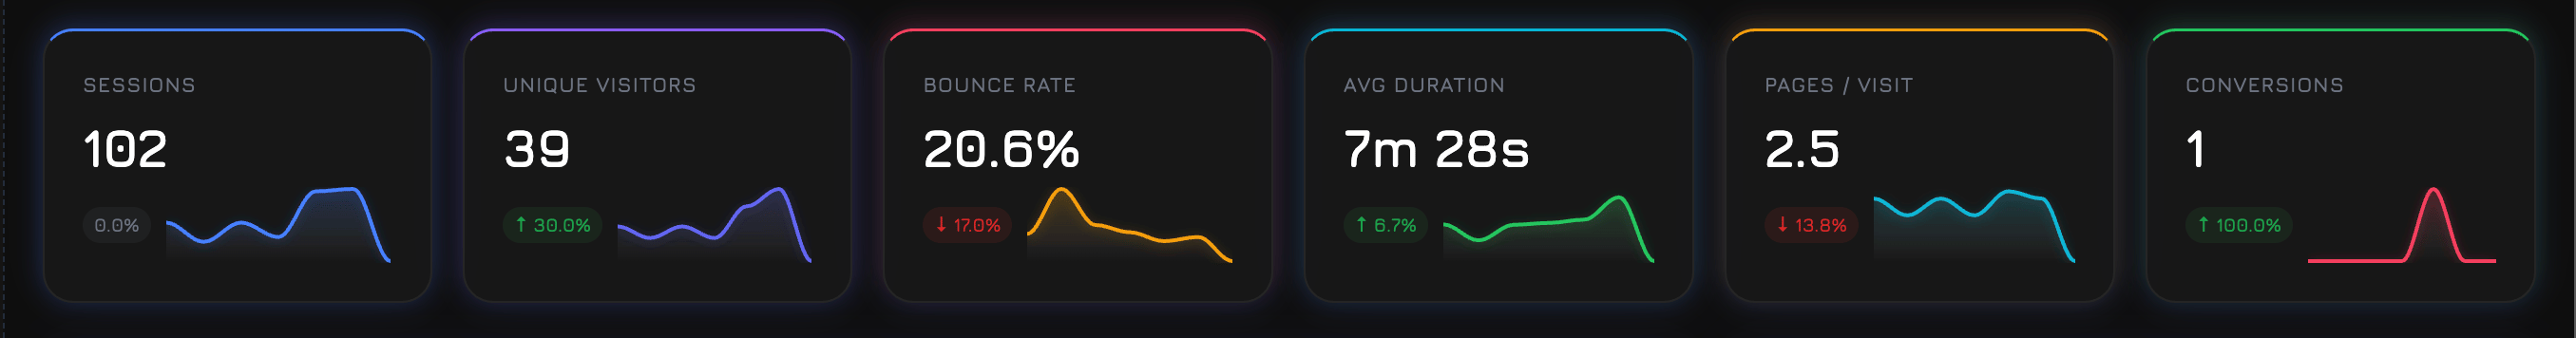 ### Sessions
Total number of visitor sessions in the selected period. A session starts when a visitor loads your website and ends after 30 minutes of inactivity or when they leave.
**Calculation:** `COUNT(*)` from all sessions in the period.
### Unique Visitors
Number of distinct visitors, identified by a unique browser token. One person visiting your site 5 times = 1 unique visitor but 5 sessions.
**Calculation:** `COUNT(DISTINCT guest_token)` from sessions.
### Bounce Rate
Percentage of sessions where the visitor viewed only one page and left without further interaction. A lower bounce rate generally indicates better engagement.
**Calculation:** `(sessions with 1 pageview / total sessions) × 100%`
The trend arrow for bounce rate is **inverted** — a decrease (green arrow) means improvement, while an increase (red arrow) means more visitors are leaving after one page.
### Avg Duration
Average time visitors spend on your website per session, displayed in seconds or minutes.
**Calculation:** `AVG(duration_seconds)` across all sessions.
### Pages / Visit
Average number of pages viewed per session. Higher values indicate visitors are exploring more of your content.
**Calculation:** `AVG(pages_visited)` across all sessions.
### Conversions
Number of unique sessions that triggered at least one event marked as a **Conversion Goal**. You define which events count as conversions in the Events tab.
**Calculation:** `COUNT(DISTINCT session_id)` where the session contains at least one event with `is_conversion = true`.
To set up conversions, go to the **Events** tab, create or edit an event, and toggle the **"Conversion Goal"** switch. Any event type can be a conversion — form submissions, button clicks, page views, or custom events.
***
## Sessions Over Time
An area chart showing traffic trends over the selected period. Two overlaid lines:
* **Sessions** — total sessions per day
* **Visitors** — unique visitors per day
Use this to identify traffic spikes, trends, and the gap between total visits and unique visitors (repeat visit ratio).
### Sessions
Total number of visitor sessions in the selected period. A session starts when a visitor loads your website and ends after 30 minutes of inactivity or when they leave.
**Calculation:** `COUNT(*)` from all sessions in the period.
### Unique Visitors
Number of distinct visitors, identified by a unique browser token. One person visiting your site 5 times = 1 unique visitor but 5 sessions.
**Calculation:** `COUNT(DISTINCT guest_token)` from sessions.
### Bounce Rate
Percentage of sessions where the visitor viewed only one page and left without further interaction. A lower bounce rate generally indicates better engagement.
**Calculation:** `(sessions with 1 pageview / total sessions) × 100%`
The trend arrow for bounce rate is **inverted** — a decrease (green arrow) means improvement, while an increase (red arrow) means more visitors are leaving after one page.
### Avg Duration
Average time visitors spend on your website per session, displayed in seconds or minutes.
**Calculation:** `AVG(duration_seconds)` across all sessions.
### Pages / Visit
Average number of pages viewed per session. Higher values indicate visitors are exploring more of your content.
**Calculation:** `AVG(pages_visited)` across all sessions.
### Conversions
Number of unique sessions that triggered at least one event marked as a **Conversion Goal**. You define which events count as conversions in the Events tab.
**Calculation:** `COUNT(DISTINCT session_id)` where the session contains at least one event with `is_conversion = true`.
To set up conversions, go to the **Events** tab, create or edit an event, and toggle the **"Conversion Goal"** switch. Any event type can be a conversion — form submissions, button clicks, page views, or custom events.
***
## Sessions Over Time
An area chart showing traffic trends over the selected period. Two overlaid lines:
* **Sessions** — total sessions per day
* **Visitors** — unique visitors per day
Use this to identify traffic spikes, trends, and the gap between total visits and unique visitors (repeat visit ratio).
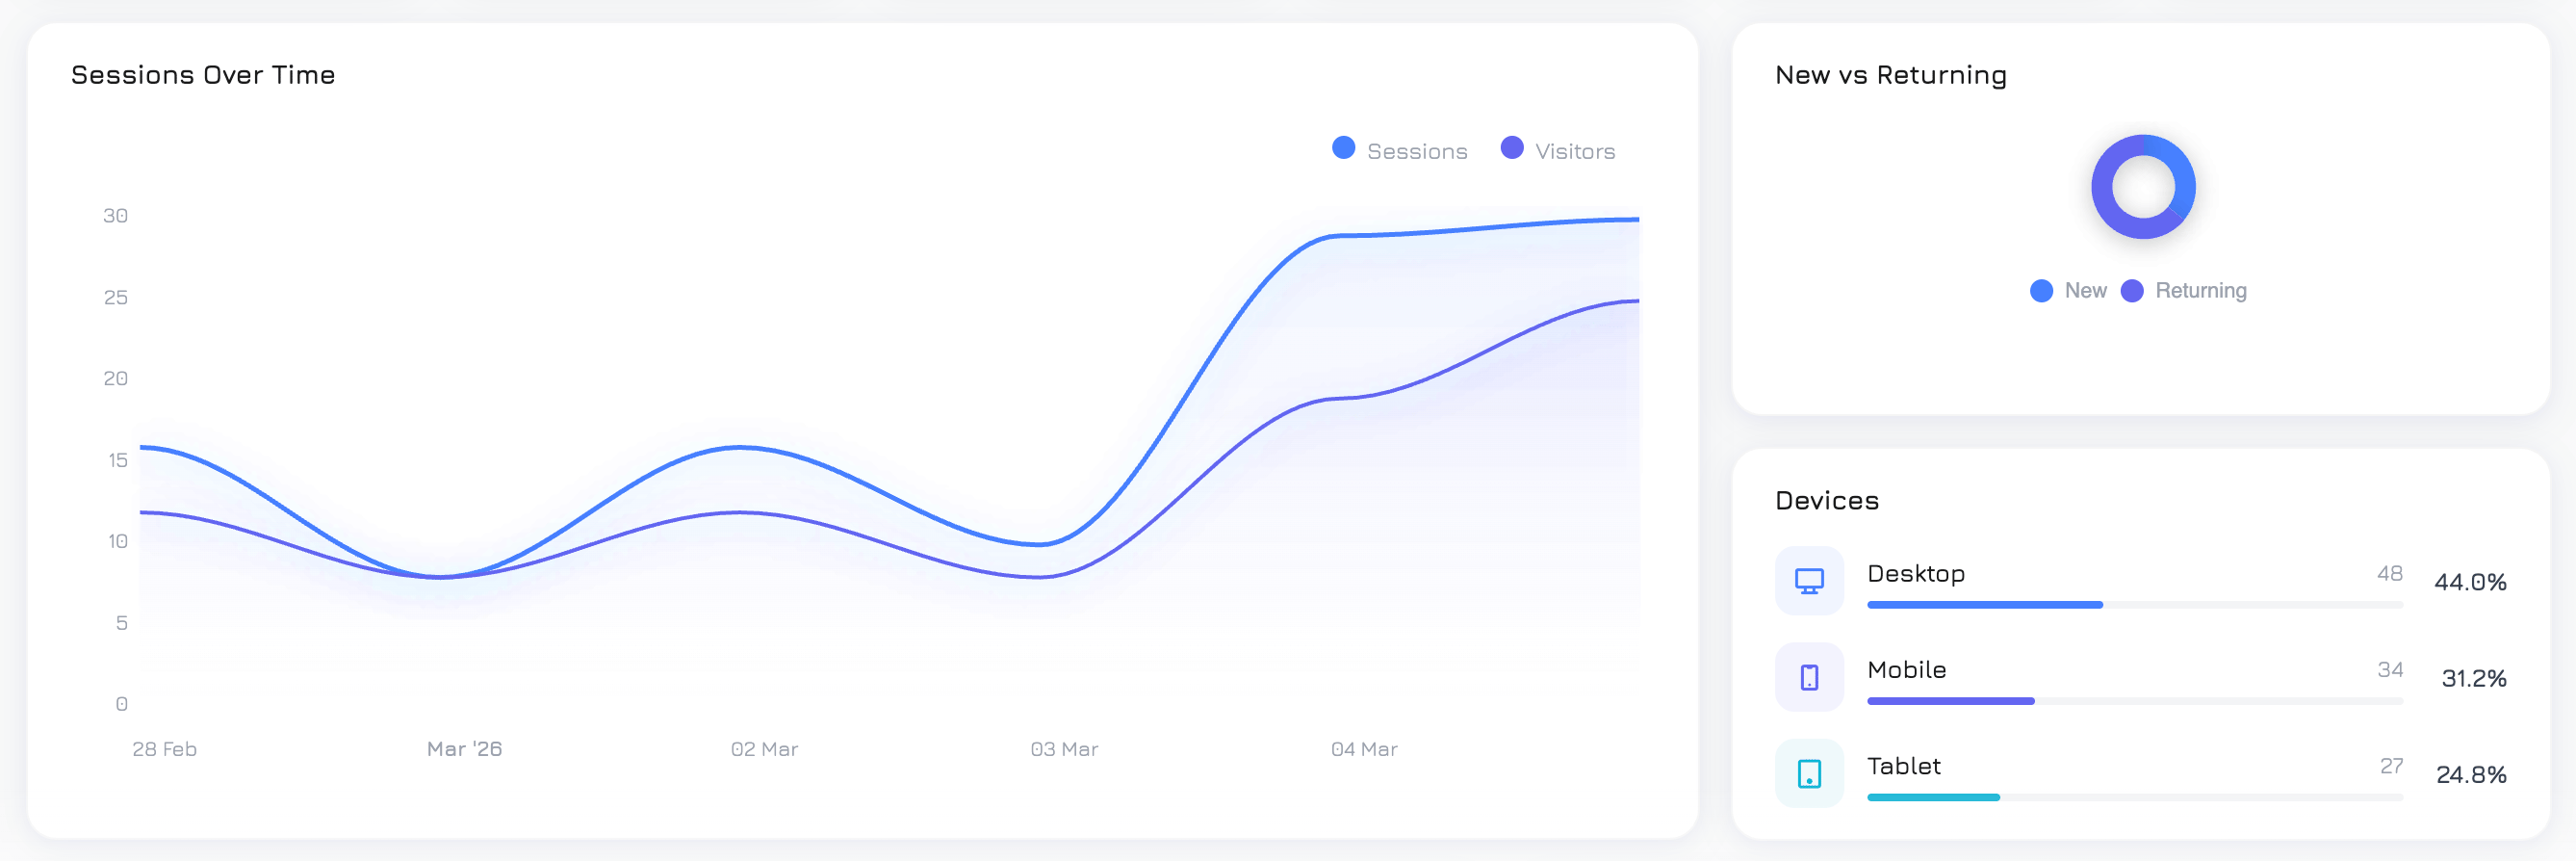
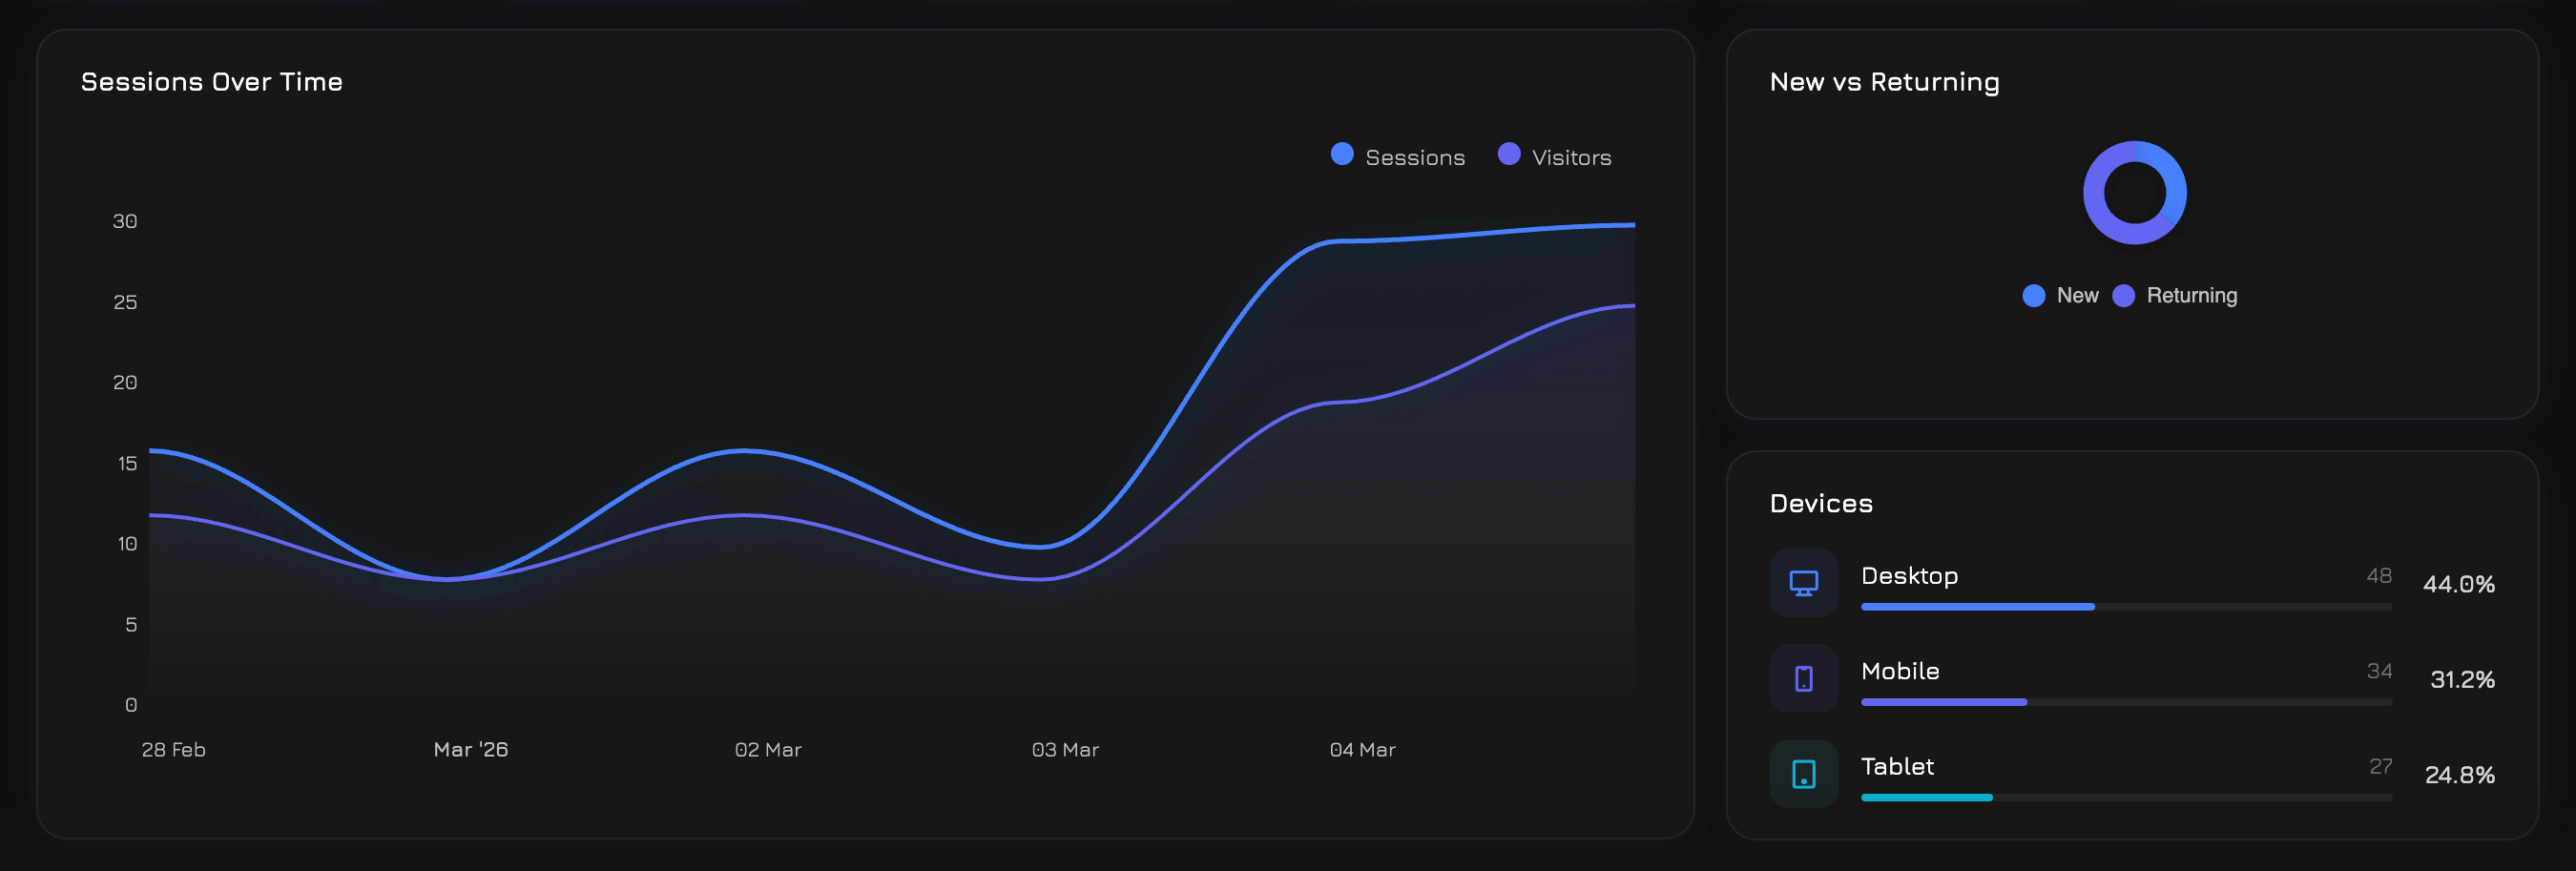 ## New vs Returning
A donut chart showing the split between:
* **New visitors** — first-time visitors (only 1 session ever)
* **Returning visitors** — visitors who have been to your site before (2+ sessions)
A healthy mix depends on your business: content sites aim for more returning visitors, while ad-driven landing pages expect mostly new visitors.
***
## Top Pages
A table of the 10 most visited pages, showing:
| Column | Description |
| -------------- | -------------------------------------------------------------------------- |
| **Page URL** | The page path |
| **Views** | Total pageview count |
| **Avg Time** | Average time spent on the page (milliseconds converted to readable format) |
| **Avg Scroll** | Average scroll depth percentage — how far down visitors scroll |
Use this to identify your most popular content and pages where visitors engage the most (or the least).
## New vs Returning
A donut chart showing the split between:
* **New visitors** — first-time visitors (only 1 session ever)
* **Returning visitors** — visitors who have been to your site before (2+ sessions)
A healthy mix depends on your business: content sites aim for more returning visitors, while ad-driven landing pages expect mostly new visitors.
***
## Top Pages
A table of the 10 most visited pages, showing:
| Column | Description |
| -------------- | -------------------------------------------------------------------------- |
| **Page URL** | The page path |
| **Views** | Total pageview count |
| **Avg Time** | Average time spent on the page (milliseconds converted to readable format) |
| **Avg Scroll** | Average scroll depth percentage — how far down visitors scroll |
Use this to identify your most popular content and pages where visitors engage the most (or the least).
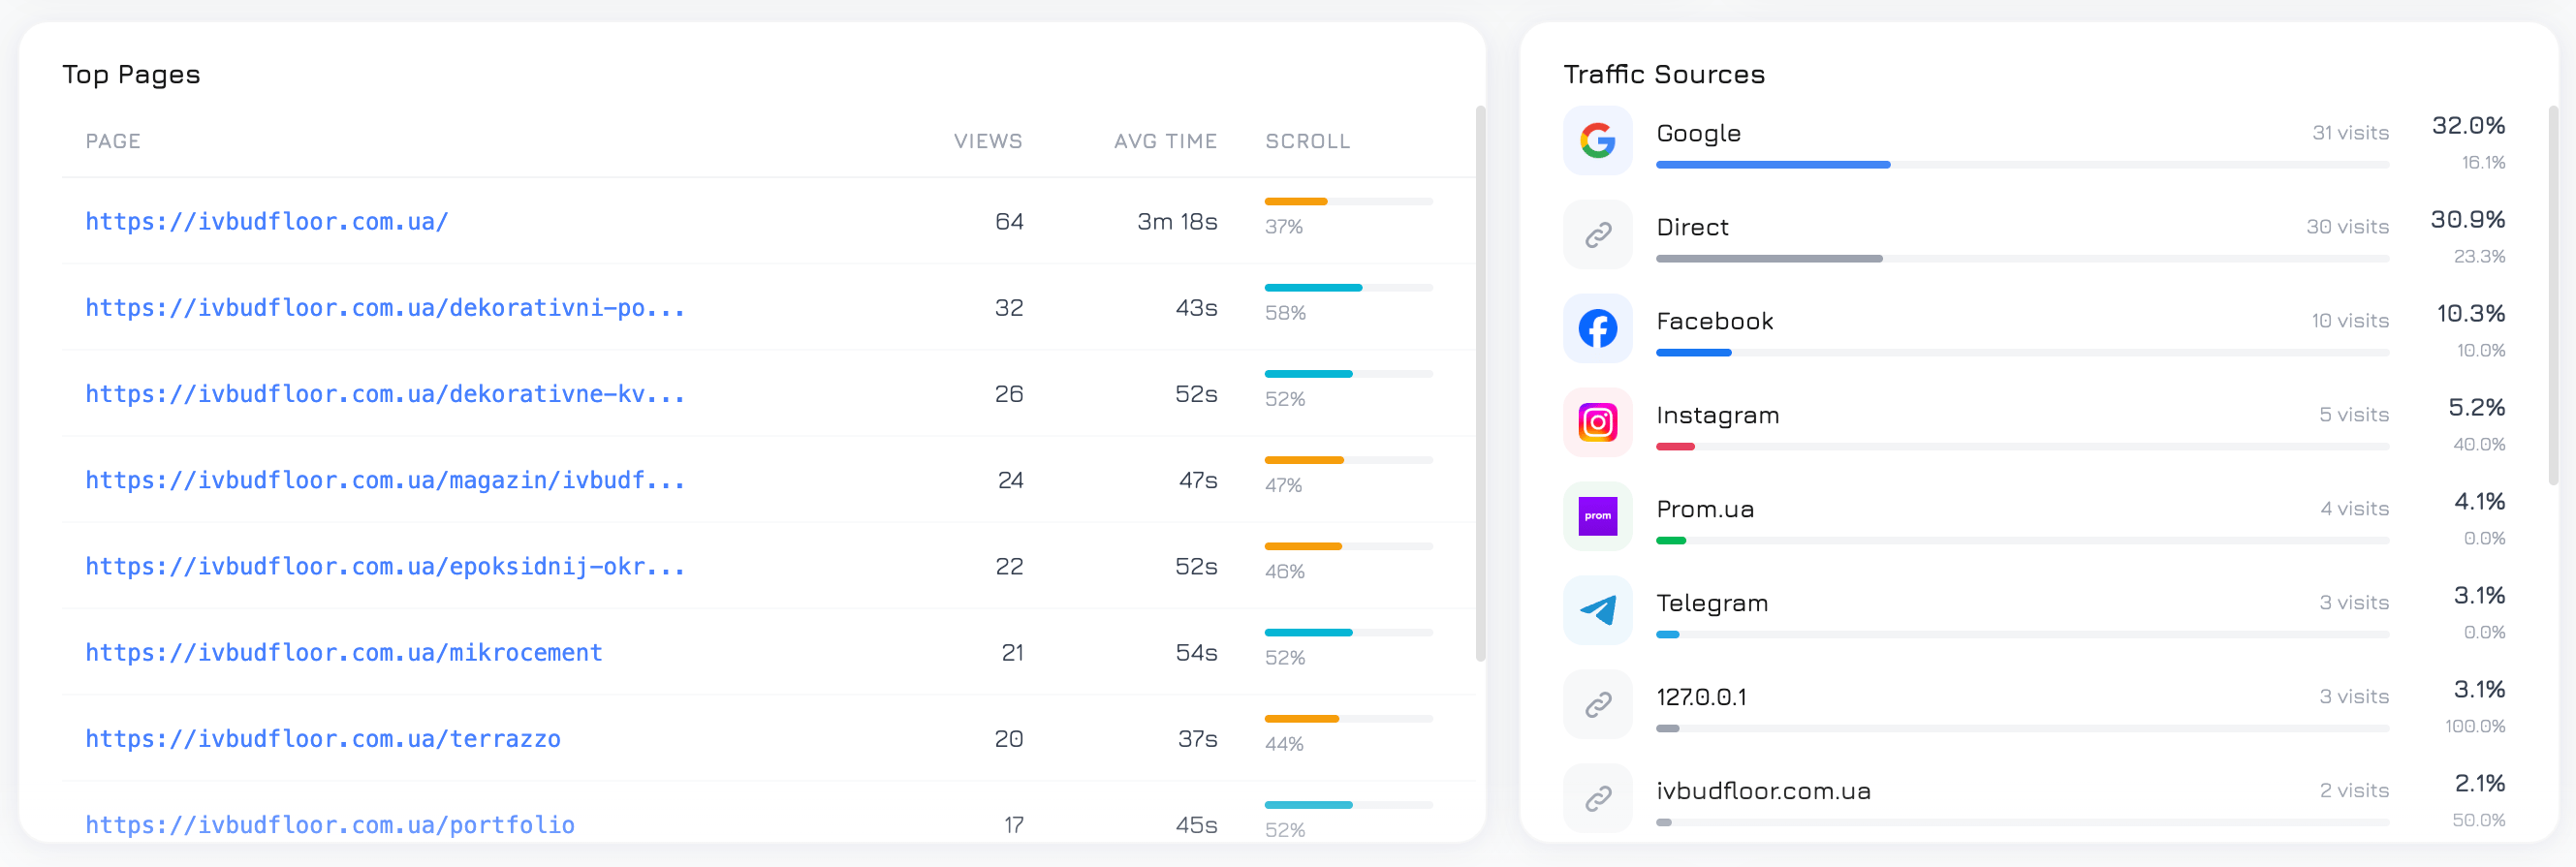
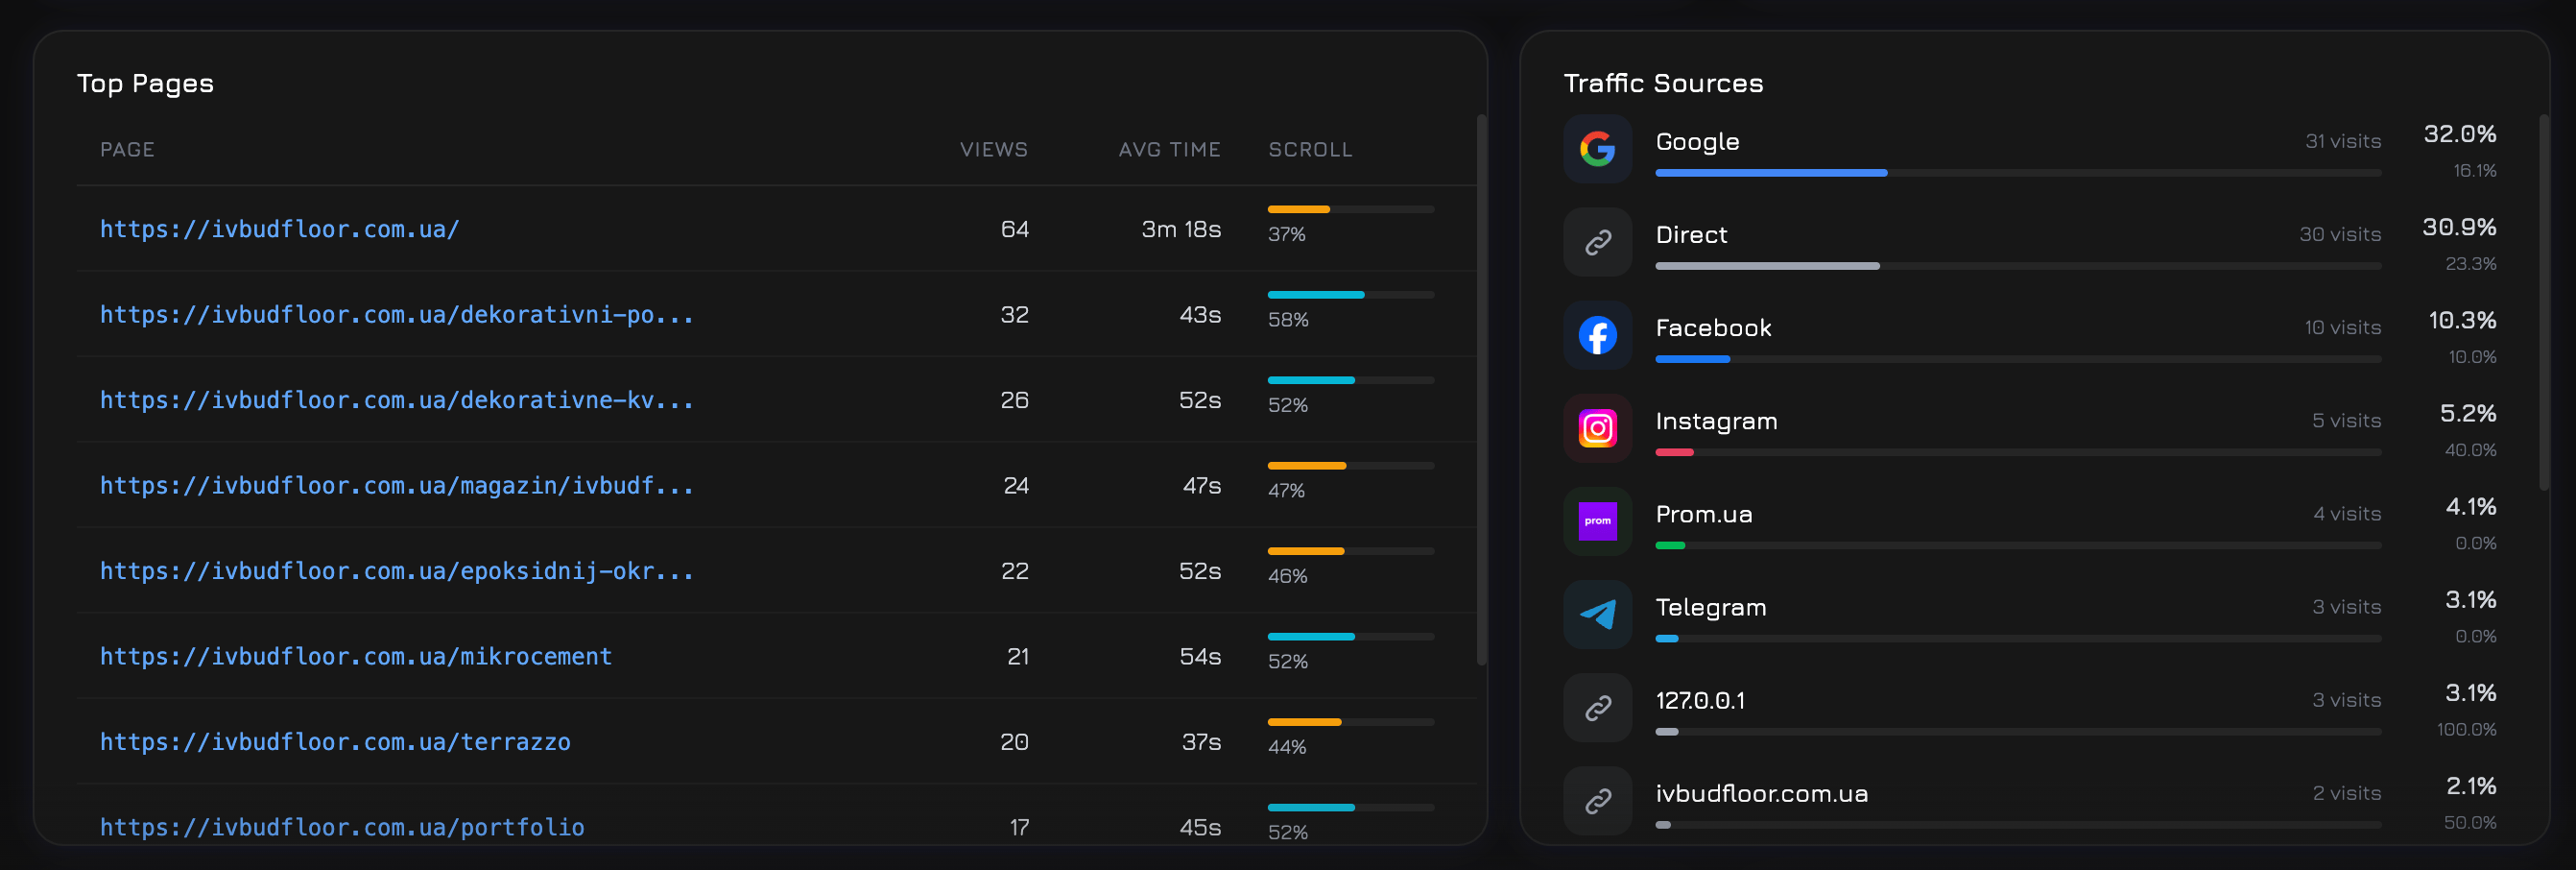 ## Traffic Sources
Top 15 traffic sources by visitor count, with source logos (Google, Facebook, TikTok, etc.) and metrics:
| Column | Description |
| --------------- | ----------------------------------------------------- |
| **Source** | Where the visitor came from (utm\_source or referrer) |
| **Visitors** | Unique visitor count from this source |
| **Bounce Rate** | Percentage of single-page sessions from this source |
Sessions without a source are grouped as **"direct"** (typed URL or bookmark).
***
## Visitor Globe
An interactive 3D globe visualization showing where your visitors are located. Countries with more traffic appear as brighter hotspots.
## All Countries
A detailed list of countries with:
| Column | Description |
| ------------------- | ----------------------------------- |
| **Country** | Flag icon and country name |
| **Sessions** | Total sessions from this country |
| **Unique Visitors** | Distinct visitors from this country |
The globe and country list use the visitor's IP-based geolocation data.
***
## Session Duration
A histogram showing how long visitors stay on your site, grouped into 6 buckets:
| Bucket | Description |
| ------------ | ---------------------------------- |
| **0–10s** | Very short visits (likely bounces) |
| **10–30s** | Quick glances |
| **30–60s** | Brief visits |
| **1–3 min** | Moderate engagement |
| **3–10 min** | Good engagement |
| **10+ min** | Deep engagement |
## Scroll Depth
A histogram showing how far visitors scroll on your pages, in 4 buckets:
| Bucket | Description |
| ----------- | ---------------------------- |
| **0–25%** | Saw only the top of the page |
| **25–50%** | Scrolled to the middle |
| **50–75%** | Read most of the page |
| **75–100%** | Reached the bottom |
Use this to understand if visitors are reading your full content or dropping off early.
## Hourly Traffic
A 24-hour bar chart showing session distribution by hour of day (0–23). Identifies peak traffic hours — useful for scheduling campaigns, support staffing, or content publishing.
***
## Top Events
A bar chart of the 6 most fired event definitions. Events are custom actions you define in the Events tab (clicks, form submissions, scroll triggers, etc.).
## Trigger Activity
A bar chart of the 6 most active triggers. Triggers are automated actions (popups, overlays, alerts) that fire based on visitor behavior rules you define in the Triggers tab.
***
## Campaign Performance
A table of the top 10 campaigns plus a **(Direct / Organic)** row for unattributed traffic:
| Column | Description |
| ------------------- | ------------------------------------------------------- |
| **Campaign** | Campaign name (from UTM parameters or manually created) |
| **Sessions** | Total sessions attributed to this campaign |
| **Events** | Number of tracked events fired in campaign sessions |
| **Triggers** | Number of trigger activations in campaign sessions |
| **Phone Swaps** | Phone number substitution events |
| **Bounce Rate** | % of single-page sessions |
| **Avg Duration** | Average session duration in seconds |
| **Conversations** | Number of chat conversations started |
| **Conversion Rate** | % of sessions with at least one conversion event |
## Traffic Sources
Top 15 traffic sources by visitor count, with source logos (Google, Facebook, TikTok, etc.) and metrics:
| Column | Description |
| --------------- | ----------------------------------------------------- |
| **Source** | Where the visitor came from (utm\_source or referrer) |
| **Visitors** | Unique visitor count from this source |
| **Bounce Rate** | Percentage of single-page sessions from this source |
Sessions without a source are grouped as **"direct"** (typed URL or bookmark).
***
## Visitor Globe
An interactive 3D globe visualization showing where your visitors are located. Countries with more traffic appear as brighter hotspots.
## All Countries
A detailed list of countries with:
| Column | Description |
| ------------------- | ----------------------------------- |
| **Country** | Flag icon and country name |
| **Sessions** | Total sessions from this country |
| **Unique Visitors** | Distinct visitors from this country |
The globe and country list use the visitor's IP-based geolocation data.
***
## Session Duration
A histogram showing how long visitors stay on your site, grouped into 6 buckets:
| Bucket | Description |
| ------------ | ---------------------------------- |
| **0–10s** | Very short visits (likely bounces) |
| **10–30s** | Quick glances |
| **30–60s** | Brief visits |
| **1–3 min** | Moderate engagement |
| **3–10 min** | Good engagement |
| **10+ min** | Deep engagement |
## Scroll Depth
A histogram showing how far visitors scroll on your pages, in 4 buckets:
| Bucket | Description |
| ----------- | ---------------------------- |
| **0–25%** | Saw only the top of the page |
| **25–50%** | Scrolled to the middle |
| **50–75%** | Read most of the page |
| **75–100%** | Reached the bottom |
Use this to understand if visitors are reading your full content or dropping off early.
## Hourly Traffic
A 24-hour bar chart showing session distribution by hour of day (0–23). Identifies peak traffic hours — useful for scheduling campaigns, support staffing, or content publishing.
***
## Top Events
A bar chart of the 6 most fired event definitions. Events are custom actions you define in the Events tab (clicks, form submissions, scroll triggers, etc.).
## Trigger Activity
A bar chart of the 6 most active triggers. Triggers are automated actions (popups, overlays, alerts) that fire based on visitor behavior rules you define in the Triggers tab.
***
## Campaign Performance
A table of the top 10 campaigns plus a **(Direct / Organic)** row for unattributed traffic:
| Column | Description |
| ------------------- | ------------------------------------------------------- |
| **Campaign** | Campaign name (from UTM parameters or manually created) |
| **Sessions** | Total sessions attributed to this campaign |
| **Events** | Number of tracked events fired in campaign sessions |
| **Triggers** | Number of trigger activations in campaign sessions |
| **Phone Swaps** | Phone number substitution events |
| **Bounce Rate** | % of single-page sessions |
| **Avg Duration** | Average session duration in seconds |
| **Conversations** | Number of chat conversations started |
| **Conversion Rate** | % of sessions with at least one conversion event |